

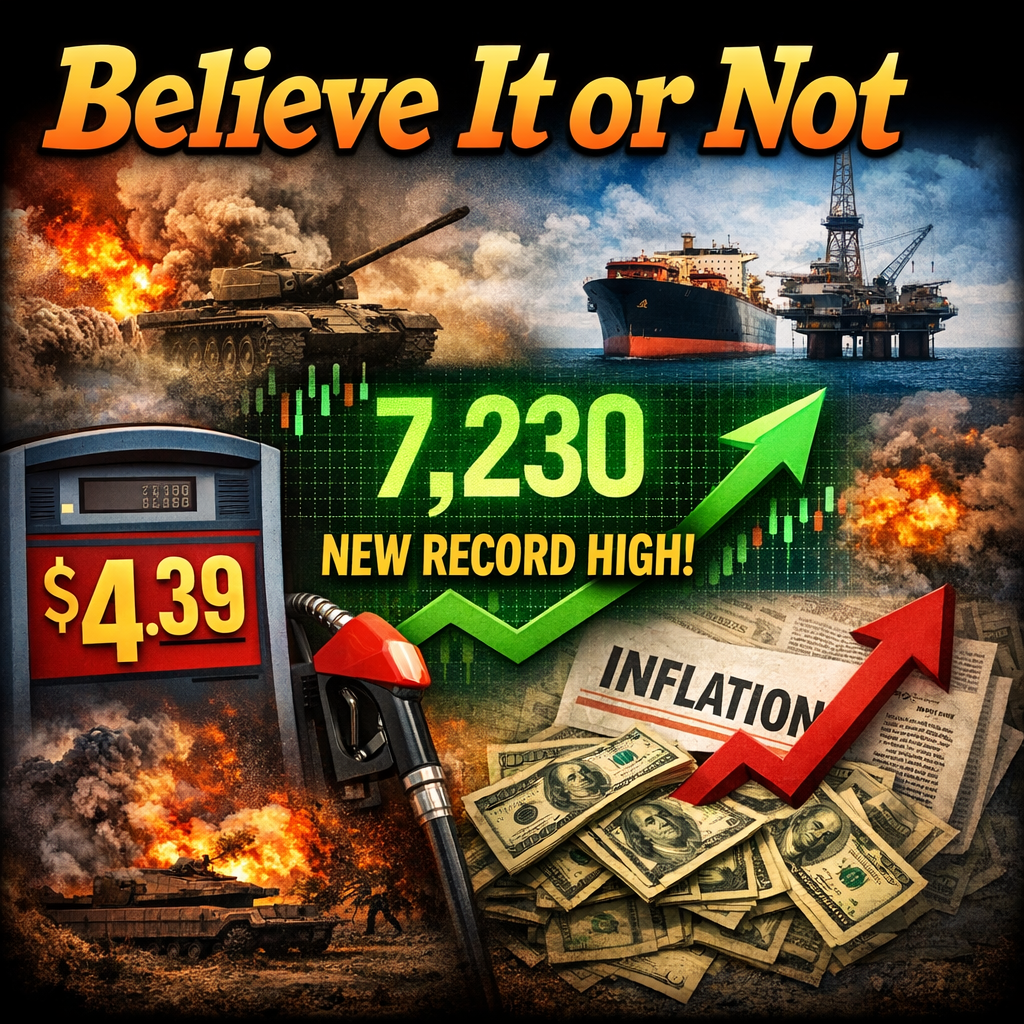
Believe It or Not
The S&P 500 finished the week at 7,230, up 0.91% and at a new all-time high. The Nasdaq closed at a record too. If you only watched the news, you'd think the economy was falling apart. The war in Ukraine just passed its four-year mark with no peace deal in sight. The Iran conflict that began in late February has kept the Strait of Hormuz effectively closed, taking roughly 20% of global oil supply offline. The U.S. military intervened in Venezuela in January, capturing Maduro and leaving the country in political limbo. Cuba is teetering on what the UN has called a potential humanitarian "collapse," cut off from Venezuelan oil and running on fumes. Gas prices have hit $4.39 a gallon nationally, the highest in four years. Brent crude recently traded above $116 a barrel before settling near $108. And inflation jumped from 2.4% to 3.3% in a single month, the sharpest move since the early days of the pandemic supply shock.
If I told you all of that and asked you to guess where the stock market was, an all-time high would not be your first answer. But here we are.
The other side of the ledger
Start with earnings. When companies make more money than expected, stocks go up. That's not a theory. It's how capital flows work. Right now, 84% of S&P 500 companies that have reported Q1 results are beating estimates, with blended earnings growth tracking 15.1% year over year. That's the sixth consecutive quarter of double-digit growth. Investors are looking at corporate balance sheets and seeing strength that the geopolitical headlines don't reflect.
Then look at the labor market. Initial jobless claims fell to 189,000 last week, the lowest since 1969. That number needs context. In 1969, the U.S. population was 203 million. Today it's 340 million. Adjusted for the size of the workforce, this may be the tightest labor market in American history. Employers are holding onto workers. That paycheck stability is a big part of why consumers keep spending even as they tell survey researchers they feel terrible about the economy.
And that's the strangest contrast of all. The University of Michigan Consumer Sentiment Index, a monthly survey measuring how households feel about their finances, business conditions, and buying intentions, fell to 49.8 in April. That's the lowest reading in the survey's 74-year history. Lower than the pandemic. Lower than the financial crisis. Lower than the stagflation of the early 1980s. Yet the same consumers driving that number to record lows are spending at a 4% annual clip and pushing retail sales above expectations month after month. People are telling you they feel bad about the economy, but their wallets are telling a different story.
What's driving the anxiety
Energy. The math is straightforward. Every extra dollar spent at the pump is a dollar that doesn't go to restaurants, retail, or travel. With gas up $1.12 from a year ago, that's real money out of household budgets. Year-ahead inflation expectations jumped to 4.7% in the Michigan survey, well above the current core PCE inflation rate of 3.2%. Consumers aren't reacting to what inflation is. They're reacting to what they think it's about to become.
The Fed
The Federal Reserve wrapped up its policy meeting this week and held rates steady. It was Chair Jerome Powell's last meeting leading the committee. Powell has elected to remain on the Board of Governors, but the chair role is set to pass to Kevin Warsh, who has been nominated but not yet confirmed by the Senate. On paper, the case for raising rates is building. Inflation has jumped to 3.3%, the labor market is historically tight, and both of those conditions would normally call for tighter policy. But this isn't demand-driven inflation. It's an energy shock caused by a war. Raising rates doesn't reopen the Strait of Hormuz or bring oil prices down. It just slows an economy that, so far, is absorbing the shock. The Fed is choosing to wait, and the FedWatch tool shows the market is watching closely. Hike probability (28.8%) now exceeds cut probability (10.2%) for the first time since we began tracking the 12-month rolling measure.
The data doesn't lie
Whatever the headlines say, the numbers tell their own story.
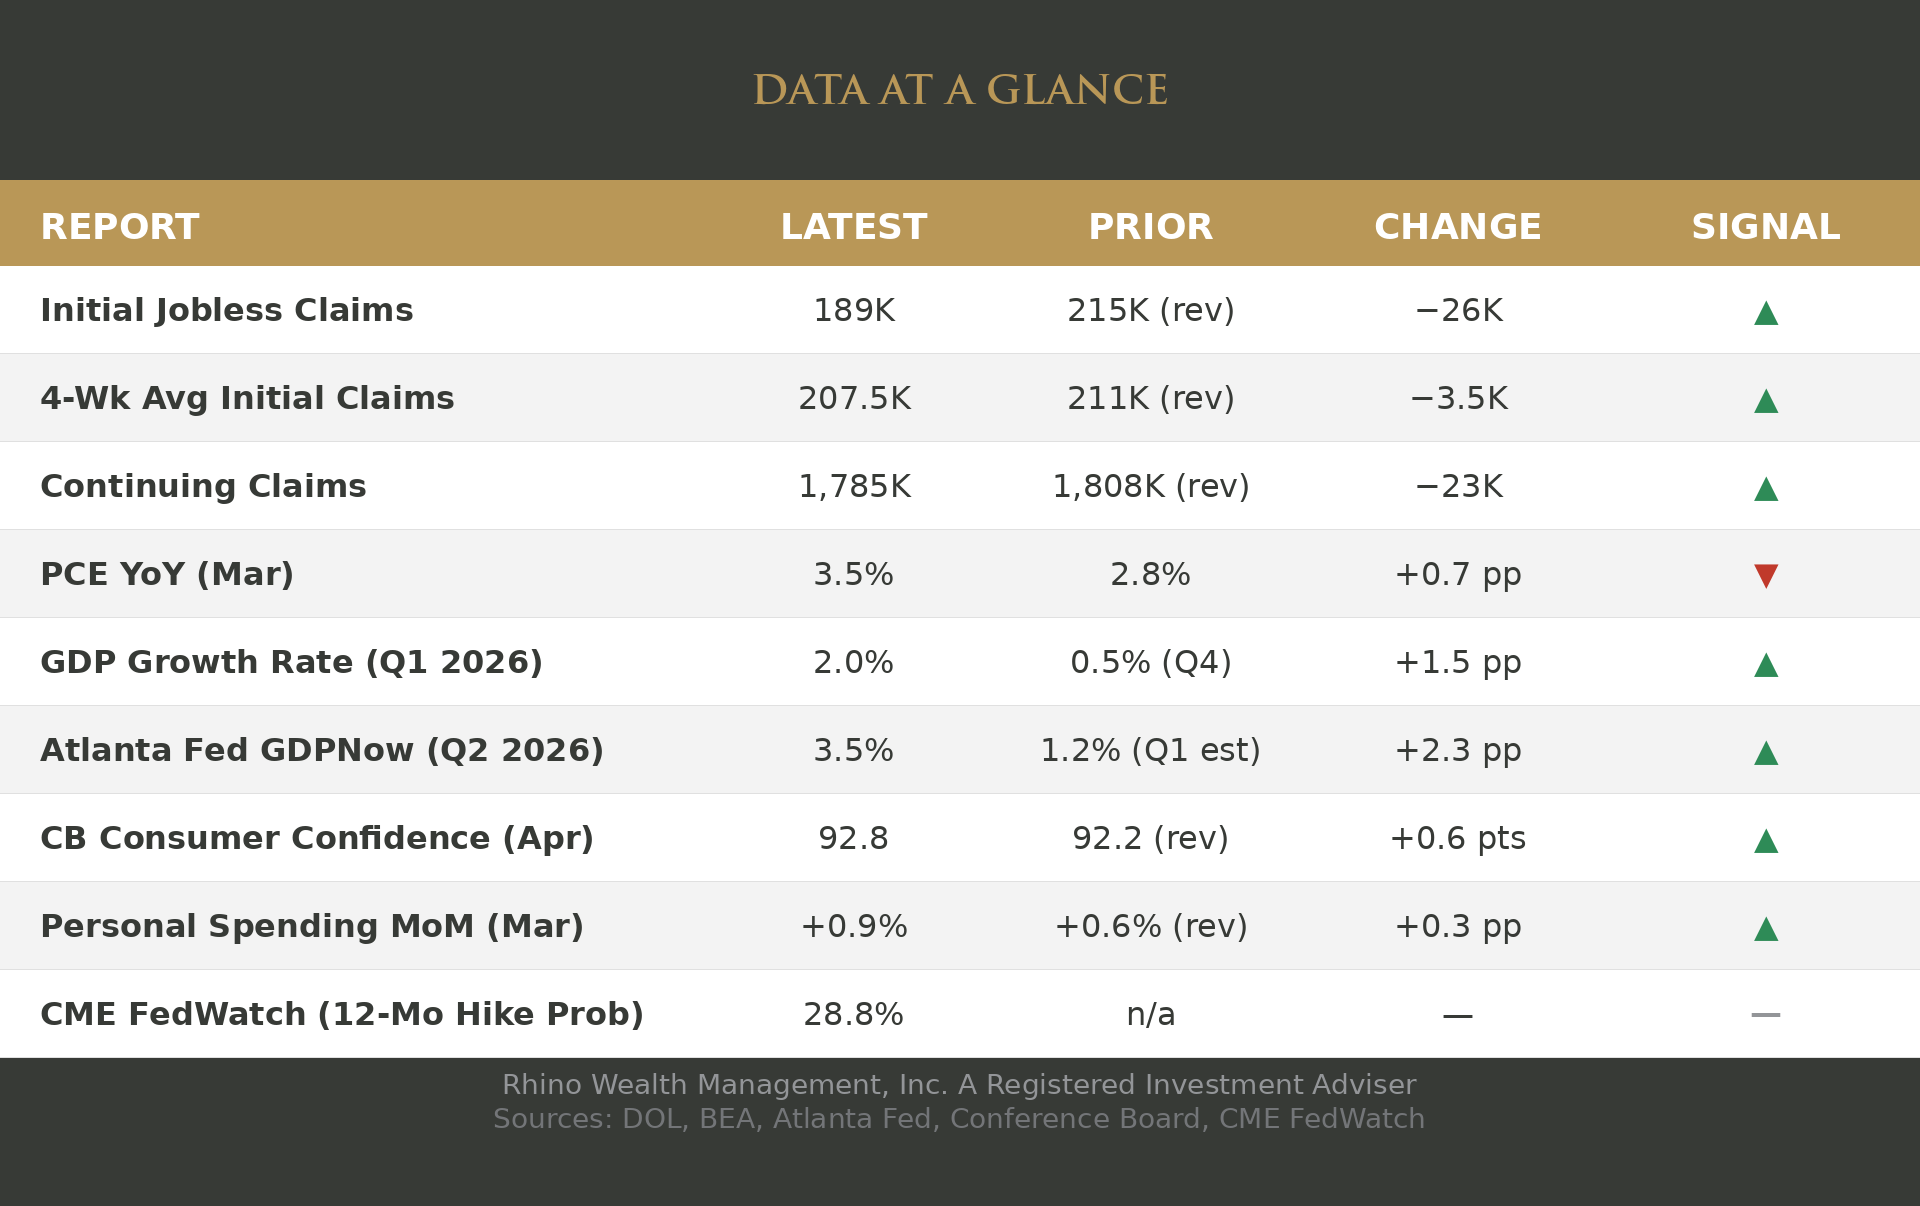
Initial claims dropped 26,000 in a single week to 189,000. The four-week average fell to 207,500. Continuing claims dropped to 1,785,000, the lowest in two years, meaning the people who do lose their jobs are finding new ones quickly. GDP growth for Q1 came in at 2.0%, a meaningful rebound from the 0.5% reading in Q4 2025. The Atlanta Fed's GDPNow model is already tracking Q2 at 3.5%. Personal spending rose 0.9% in March. Consumer confidence ticked up to 92.8. These are not the numbers of an economy in trouble. They are the numbers of an economy absorbing a genuine energy shock and, so far, holding up.
See glossary below for definitions of each metric.
What resolves it
The same question I've been asking for weeks. Does the energy shock stay contained, or does it spread into the broader economy? Core PCE inflation, the Fed's preferred measure that strips out food and energy, is running at 3.2%. That's elevated, but it hasn't spiked the way headline inflation has. That's the number to watch. If it holds here, the gap between terrible sentiment and strong fundamentals eventually closes with sentiment catching up to reality. If core inflation starts climbing, it closes the other way, with the economy catching down to how people feel.
For now, the data says the economy is stronger than the headlines suggest.
Glossary of Terms
- Initial Jobless Claims (189K) — Number of people filing for unemployment benefits for the first time in a given week. Lower is better for the economy. It means fewer people are losing their jobs. Source: Department of Labor.
- 4-Wk Avg Initial Claims (207.5K) — Four-week moving average that smooths out the week-to-week noise in initial claims. Gives a cleaner read on the labor market trend. Source: Department of Labor.
- Continuing Claims (1,785K) — Total number of people currently receiving unemployment benefits. Lower means people are finding new jobs faster rather than staying on benefits. Source: Department of Labor.
- PCE YoY, Mar (3.5%) — Personal Consumption Expenditures price index, year-over-year. This is the Fed's preferred inflation measure. A higher number means prices are rising faster than the prior year. Source: Bureau of Economic Analysis.
- GDP Growth Rate, Q1 2026 (2.0%) — The annualized rate at which the U.S. economy grew in the first quarter. This is the advance (first) estimate from BEA and will be revised twice. Source: Bureau of Economic Analysis.
- Atlanta Fed GDPNow, Q2 2026 (3.5%) — A real-time model estimate of GDP growth for the current quarter, updated as new economic data is released. It is not an official forecast. Think of it as a running nowcast that reflects data in hand. Source: Federal Reserve Bank of Atlanta.
- CB Consumer Confidence, Apr (92.8) — A survey-based index measuring how optimistic or pessimistic consumers feel about current business conditions and the job market, plus their expectations for the next six months. Higher readings mean more confidence. Source: The Conference Board.
- Personal Spending MoM, Mar (+0.9%) — Month-over-month change in total consumer spending. Consumer spending drives roughly two-thirds of GDP, so this is a direct read on the engine of economic growth. Source: Bureau of Economic Analysis.
- CME FedWatch 12-Mo Hike Prob (28.8%) — The market-implied probability that the Fed will raise interest rates at least once over the next 12 months, derived from fed funds futures pricing. This week marked a direction flip: hike probability (28.8%) now exceeds cut probability (10.2%) by 18.6 percentage points, the first time this has happened since we adopted the 12-month rolling framing. Source: CME FedWatch Tool.
Disclosure
This material is provided by Todd Van Der Meid, MBA, CFP®, through Rhino Wealth Management, Inc., a Registered Investment Adviser, solely for informational purposes. It is not intended as investment, tax, legal, or accounting advice. Investors should consult qualified professionals before making financial decisions.
Opinions expressed herein are general in nature and not tailored to individual circumstances. Investment strategies discussed may not be suitable for every investor. All investments carry risk, including possible loss of principal, and past performance does not guarantee future results. No investment strategy or risk management technique ensures profit or eliminates risk in all market conditions.
Investments in foreign or emerging markets involve additional risks, such as currency fluctuations, geopolitical instability, and varying accounting standards. Sector-specific investments can be more volatile due to their concentrated nature. References to indexes are for illustrative purposes; indexes are unmanaged, cannot be invested into directly, and their performance does not reflect fees, expenses, or sales charges. Index performance is not indicative of specific investment performance.
Economic forecasts and forward-looking statements reflect current views and assumptions and are subject to change. Actual results may vary materially due to market or other conditions. There is no obligation to update forward-looking information.
Information presented herein comes from reliable third-party sources but is not guaranteed for accuracy or completeness. Rhino Wealth Management, Inc. disclaims liability for errors or omissions. Portions of this content may be generated using advanced analytical tools, including artificial intelligence, and all such content has been reviewed and validated by Todd Van Der Meid, MBA, CFP®, using proprietary quality-control measures. Rhino Wealth Management, Inc. does not directly hold securities; however, securities mentioned may be included within recommended portfolio models or held by clients. Please refer to our Form ADV for additional details regarding potential conflicts of interest.