

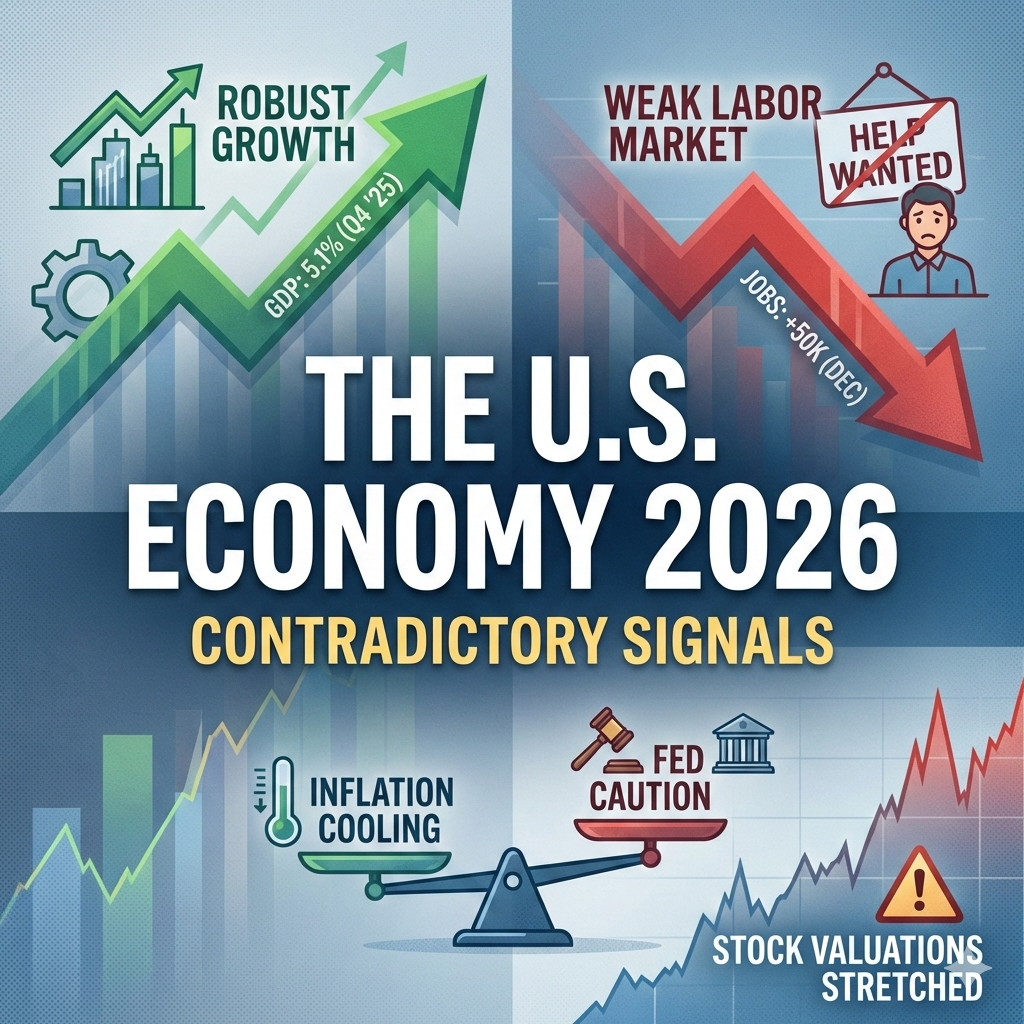
Growth Without Jobs
The U.S. economy enters 2026 sending contradictory signals. Economic growth remains robust, with the Atlanta Fed's GDPNow model estimating 5.1% for the final quarter of 2025. Services businesses expanded in December at their fastest pace all year, with the ISM Services PMI reaching 54.4. Yet the labor market tells a darker story. The economy added just 50,000 jobs in December, capping 2025 as the weakest year for employment growth since 2003 outside of recession years. Job openings have fallen to 7.1 million, meaning there are now fewer open positions than unemployed workers for the first time since early 2021. Manufacturing has contracted for ten consecutive months.
What makes this performance particularly notable is its resilience amid significant global instability. The ongoing war in Ukraine, military action in Venezuela, and uprisings across Iran have created geopolitical tensions that historically would have rattled markets. Yet the U.S. economy has largely absorbed these shocks.
Three developments could reshape the landscape in the weeks ahead. First, President Trump confirmed he will announce his Federal Reserve chair nominee in January to replace Jerome Powell when his term expires in May. Treasury Secretary Scott Bessent said Thursday that four candidates remain under consideration. Trump has made clear he wants a Fed chair committed to aggressive rate cuts, creating potential tension between political pressure and inflation control.
Second, crucial inflation data arrives next week when December's Consumer Price Index releases Tuesday, January 13. After November's surprisingly low CPI reading was complicated by the government shutdown disrupting data collection, December's figures will provide clearer evidence of whether inflation is genuinely cooling. Any upside surprise could force markets to reprice their expectations for June rate cuts.
Third, stock valuations have reached extreme levels drawing warnings from major Wall Street firms. Bank of America's chief strategist noted this week that the S&P 500 has "never been more expensive" across multiple metrics, with the equity risk premium (the extra return investors demand for owning stocks instead of safer government bonds) near zero. The index trades at a CAPE ratio above 40, a level exceeded only once before: during the dot-com bubble of 1999-2000, when it peaked around 44. The CAPE, or cyclically adjusted price-to-earnings ratio, smooths out earnings over ten years to filter short-term volatility and provide a clearer picture of underlying valuation. Stretched valuations leave little margin for error if economic growth disappoints or if the AI spending boom begins to falter.
The Federal Reserve faces this mixed picture with caution. Markets expect rates to hold steady at 3.50%-3.75% through the first half of 2026, with the first cut most likely arriving in June. Inflation continues cooling, with Core PCE around 2.8% year-over-year, still above the Fed's 2% target. The path forward depends on whether this slowdown represents a healthy normalization or the beginning of something more concerning.
Fed Update / Nowcast Dashboard
Fed Funds Rate Outlook
Current Target Rate: 3.50% - 3.75%
| FOMC Meeting | Hold | 1 Cut | 2 Cuts |
|---|---|---|---|
| Jan 27-28, 2026 | 95% | 5% | — |
| Mar 17-18, 2026 | 71% | 28% | 1% |
| Apr 28-29, 2026 | 58% | 36% | 6% |
| Jun 17, 2026 | 28% | 47% | 21% |
| Sep 15-16, 2026 | 13% | 33% | 34% |
Market probabilities as of January 9, 2026. Futures-implied odds shift daily. "Cuts" are cumulative from current 3.50%-3.75% target range.
2026 Outlook: Markets expect the Federal Reserve to hold rates steady through the first half of the year, with the first 25 basis point cut most likely arriving in June (68% cumulative cut probability). By September, markets price in a second cut as increasingly probable, with 67% odds of at least two total cuts by then. This gradual easing trajectory aligns with the Fed's December dot plot projection of one to two cuts in 2026, bringing the median rate to approximately 3.1%-3.4% by year-end.
Atlanta Fed GDPNow
Volatility Note: This dramatic revision was driven primarily by trade data. Net exports swung from a -0.30 percentage point drag to a +1.97 percentage point boost, a 2.27 percentage point shift. GDPNow estimates can be volatile as new data arrives and should not be interpreted as a final forecast.
Cleveland Fed Inflation Nowcasting
| Measure (YoY) | Jan 2026 | Dec 2025 | Trend |
|---|---|---|---|
| CPI | 2.24% | 2.57% | ↓ Cooling |
| Core CPI | 2.45% | 2.64% | ↓ Cooling |
| PCE | 2.38% | 2.58% | ↓ Cooling |
| Core PCE | 2.64% | 2.73% | ↓ Cooling |
Note: The Bureau of Labor Statistics could not collect October 2025 CPI survey data during the lapse in appropriations and could not retroactively collect it. Cleveland Fed nowcasts are used for missing values.
The Federal Reserve is widely expected to hold rates steady at its January 27-28 meeting, with futures markets pricing a 95% probability of no change. Markets anticipate the first rate cut will likely arrive in June, with a 47% probability of one cut by then and cumulative odds of 72% for at least one cut. A second cut becomes more likely by September, with markets pricing 67% odds of at least two total cuts by year-end. This gradual easing path aligns with the Fed's December dot plot, which projected one to two cuts in 2026. Meanwhile, economic growth appears robust. The Atlanta Fed's GDPNow model stands at 5.1% for Q4 2025, down slightly from 5.4% earlier this week but still elevated compared to 2.7% from January 5. This surge was driven largely by volatile trade data. On inflation, all major measures continue cooling. Core PCE (the Fed's preferred gauge) stands at 2.64% year-over-year, still above the 2% target but trending downward. For households, this outlook suggests borrowing costs will remain elevated through mid-2026, with gradual relief potentially arriving in the second half of the year.
CME Group (2026) CME FedWatch Tool. Available at: https://www.cmegroup.com/markets/interest-rates/cme-fedwatch-tool.html (Accessed: 9 January 2026).
Federal Reserve Bank of Atlanta (2026) GDPNow. Available at: https://www.atlantafed.org/cqer/research/gdpnow (Accessed: 9 January 2026).
Federal Reserve Bank of Cleveland (2026) Inflation Nowcasting. Available at: https://www.clevelandfed.org/indicators-and-data/inflation-nowcasting (Accessed: 9 January 2026).
Employment Situation
| Sector | Jobs Added/Lost |
|---|---|
| Food Services & Drinking Places | +27,000 |
| Health Care | +21,000 |
| Social Assistance | +17,000 |
| Retail Trade | -25,000 |
| Construction | -11,000 |
The U.S. economy added 50,000 jobs in December, marking the weakest annual job growth since 2003 outside of recession years. The unemployment rate (the percentage of people actively looking for work who can't find jobs) fell to 4.4%, while the broader U-6 measure (which includes discouraged workers and those in part-time jobs seeking full-time work) fell to 8.4%. Wages grew 3.8% over the past year, outpacing inflation and increasing workers' purchasing power. Restaurants and health care added jobs, while retailers cut positions.
U.S. Bureau of Labor Statistics (2026) The Employment Situation — December 2025. Available at: https://www.bls.gov/news.release/pdf/empsit.pdf (Accessed: January 9, 2026)
Weekly Unemployment Insurance Claims
Initial unemployment claims, which measure the number of Americans filing for jobless benefits for the first time, rose by 8,000 to 208,000 for the week ending January 3, 2026. The weekly increase notwithstanding, the four-week moving average dropped to 211,750, its lowest level since April 2024. This smoother measure reduces week-to-week volatility and suggests the underlying trend in layoffs remains historically low. For the week ending December 27, insured unemployment, representing people receiving ongoing benefits, increased by 56,000 to 1.914 million, while the insured unemployment rate held steady at 1.2 percent.1
1 U.S. Department of Labor (2026) Unemployment Insurance Weekly Claims, USDL 26-37-NAT. Available at: https://www.dol.gov/ui/data.pdf (Accessed: 8 January 2026).
Challenger Job Cuts Report
U.S. employers announced 35,553 job cuts in December, the lowest monthly total since July 2024 and a positive signal heading into 2026. But the full-year picture tells a different story: companies announced over 1.2 million planned job cuts in 2025, the highest since the pandemic year of 2020 and a 58% increase from 2024. Government led all sectors with 308,167 announced cuts, driven primarily by federal workforce reductions. Technology topped private-sector layoff announcements at 154,445 as companies restructured around artificial intelligence.
What this means for workers: While December's slowdown and higher hiring plans offer near-term optimism, the job market remains challenging. Employers announced just 507,647 planned hires in 2025, the lowest since 2010, suggesting those seeking new positions may face longer searches.
Challenger, Gray & Christmas, Inc. (2026) Job Cut Announcement Report: December 2025. Available at: https://www.challengergray.com/wp-content/uploads/2026/01/Challenger-Report-December-2025.pdf (Accessed: 8 January 2026).
Job Openings and Labor Turnover (JOLTS) - November 2025
U.S. job openings fell to 7.146 million in November 2025, down 303,000 from October and the lowest level since September 2024. This number came in well below market expectations of 7.60 million. The ratio of job openings to unemployed workers dropped to 0.91, meaning there are now fewer open positions than people looking for work, a reversal from the tight labor market of recent years. Restaurants, hotels, and transportation companies led the decline, while construction bucked the trend with 90,000 new openings. Hiring and layoffs held steady, suggesting employers are cautious but not cutting staff.
U.S. Bureau of Labor Statistics (2026) Job Openings and Labor Turnover Survey - November 2025. Available at: https://www.bls.gov/news.release/jolts.nr0.htm (Accessed: 8 January 2026).
ADP Employment Report
Employment Change by Company Size
Private employers added 41,000 jobs in December, rebounding from November's revised loss of 29,000 positions. Education and health services (+39,000) and leisure and hospitality (+24,000) led hiring, while professional and business services (-29,000) and information (-12,000) continued shedding jobs. Small businesses recovered from November's weakness by adding 9,000 positions, though large corporations barely grew. For workers who stayed in their current roles, wages rose 4.4% year-over-year, matching November's pace. Those who switched employers saw stronger gains at 6.6%, a reminder that job-hopping still pays off.
ADP Research and Stanford Digital Economy Lab (2026) ADP National Employment Report: December 2025. Available at: https://adpemploymentreport.com/ (Accessed: 8 January 2026).
University of Michigan Consumer Sentiment Index
The University of Michigan Consumer Sentiment Index (a measure of how confident Americans feel about the economy) rose to 54.0 in January 2026, marking its highest level since September 2025. This improvement reflects slightly better economic outlooks, particularly among lower-income households, though higher-income sentiment declined. The index remains nearly 25% below year-ago levels as Americans remain concerned about high prices and weakening job markets. While concerns about tariffs (taxes on imported goods) appear to be easing, households stay cautious about overall business conditions and employment prospects. Year-ahead inflation expectations held steady at 4.2%, well above historical norms.
University of Michigan (2026) Surveys of Consumers - January 2026 Preliminary. Available at: http://www.sca.isr.umich.edu/ (Accessed: 09 January 2026)
ISM Services PMI - December 2025
The Institute for Supply Management (ISM) Services Purchasing Managers' Index (PMI), a monthly survey measuring activity across service businesses like restaurants, healthcare, and retail, rose to 54.4 in December. Any reading above 50 signals growth. This marks the highest reading of 2025, with all four key subindexes in expansion territory for the first time since February. For everyday households, the employment index turned positive after seven months of contraction, suggesting service employers are cautiously adding staff again. New orders jumped sharply, reflecting strong demand heading into year-end. Price pressures eased slightly, though costs continue rising faster than normal.
Institute for Supply Management (2026) Services PMI at 54.4; December 2025 ISM Services PMI Report. Available at: https://www.ismworld.org/supply-management-news-and-reports/reports/ism-pmi-reports/services/december (Accessed: 8 January 2026).
ISM Manufacturing PMI (Institute for Supply Management Purchasing Managers' Index)
The Manufacturing Purchasing Managers' Index (PMI) from the Institute for Supply Management (ISM) fell to 47.9 in December 2025. This monthly survey measures factory activity, where readings below 50 signal contraction. December marked the tenth consecutive month of contraction and the lowest reading of the year. For families watching the job market, the employment component remained weak at 44.9, indicating manufacturing employment continued to contract, though at a slower pace than November. Production stayed barely positive at 51.0, while new orders improved slightly but remained in contraction territory. Perhaps most telling: 85% of manufacturing GDP contracted in December, up sharply from 58% in November.
Institute for Supply Management (2026) Manufacturing PMI at 47.9%; December 2025 Manufacturing ISM Report On Business. Available at: https://www.ismworld.org/supply-management-news-and-reports/reports/ism-pmi-reports/pmi/december (Accessed: 8 January 2026).
Disclosure
This material is provided by Todd Van Der Meid, MBA, CFP®, through Rhino Wealth Management, Inc., a Registered Investment Adviser, solely for informational purposes. It is not intended as investment, tax, legal, or accounting advice. Investors should consult qualified professionals before making financial decisions.
Opinions expressed herein are general in nature and not tailored to individual circumstances. Investment strategies discussed may not be suitable for every investor. All investments carry risk, including possible loss of principal, and past performance does not guarantee future results. No investment strategy or risk management technique ensures profit or eliminates risk in all market conditions.
Investments in foreign or emerging markets involve additional risks, such as currency fluctuations, geopolitical instability, and varying accounting standards. Sector-specific investments can be more volatile due to their concentrated nature. References to indexes are for illustrative purposes; indexes are unmanaged, cannot be invested into directly, and their performance does not reflect fees, expenses, or sales charges. Index performance is not indicative of specific investment performance.
Economic forecasts and forward-looking statements reflect current views and assumptions and are subject to change. Actual results may vary materially due to market or other conditions. There is no obligation to update forward-looking information.
Information presented herein comes from reliable third-party sources but is not guaranteed for accuracy or completeness. Rhino Wealth Management, Inc. disclaims liability for errors or omissions. Portions of this content may be generated using advanced analytical tools, including artificial intelligence, and all such content has been reviewed and validated by Todd Van Der Meid, MBA, CFP®, using proprietary quality-control measures. Rhino Wealth Management, Inc. does not directly hold securities; however, securities mentioned may be included within recommended portfolio models or held by clients. Please refer to our Form ADV for additional details regarding potential conflicts of interest.