


Market Valuations Hit Record Highs
With government data paused, we're left relying heavily on survey data—which is trending negative. Surveys capture sentiment, and sentiment during uncertainty tends to skew pessimistic. That's worth remembering as we interpret what limited information we have.
Markets have become disconnected from economic fundamentals. Valuations remain high relative to underlying earnings. Yet excessive optimism often lasts longer than fundamentals suggest is reasonable. This environment will likely persist until something forces a correction.
AI optimism is the primary driver of stock market gains. Big tech companies are investing billions in infrastructure. Cloud providers are funding AI startups, which immediately spend those funds on cloud computing capacity. This creates a loop where revenue growth looks impressive but may just be the same dollars cycling through the system.
The gap between massive infrastructure investment and actual profitability keeps widening. The technology's potential is real—I use AI tools daily—but current valuations assume profits will arrive at a scale and speed we haven't seen yet. They also assume most AI providers will succeed. Until AI investments translate to real earnings instead of revenue circulating in a closed loop, questions about sustainability remain unanswered.
Buffett Indicator (Market Cap to GDP Ratio)
The Buffett Indicator (the ratio of total stock market value to economic output or GDP) currently stands at approximately 223% as of October 2025, significantly above its 55-year historical average of 85%. This market valuation metric—which Warren Buffett called "probably the best single measure of where valuations stand at any given moment" in a 2001 Fortune magazine interview—compares the combined value of all publicly traded U.S. stocks to the nation's total economic output. At current levels, the indicator sits 2.2 standard deviations above its historical trend line, placing it in "strongly overvalued" territory and exceeding the threshold (200%) that Buffett warned meant investors were "playing with fire." The ratio reached approximately 150% during the dot-com bubble in 2000 and hit 190% in 2021, making today's reading of 223% the highest on record. Historical patterns show that when stock market valuations climb far above economic output, they eventually return to more normal levels, though the indicator doesn't predict the precise timing of market corrections.
Current Market Valuation (2025) Buffett Indicator. Available at: https://www.currentmarketvaluation.com/models/buffett-indicator.php (Accessed: October 24, 2025)
Shiller CAPE Ratio
The Cyclically Adjusted Price-to-Earnings (CAPE) ratio—a stock market valuation measure dividing the current S&P 500 price by the average of the past 10 years of inflation-adjusted company earnings—currently stands near 40. Yale economics professor Robert Shiller developed this metric, work that contributed to his 2013 Nobel Prize in Economic Sciences for analyzing investor behavior in financial markets.
This CAPE level has been exceeded only three times: before the 1929 crash, during the late 1990s dot-com bubble, and briefly in 2021. Historical data shows that when CAPE exceeds 30, the stock market's average return over the following decade drops to roughly 3-6% annually—well below the long-term historical average of around 10%.
High CAPE readings don't predict the exact timing of market downturns, but they indicate investors are paying substantially more for each dollar of corporate earnings than usual. This historically leads to lower future returns as valuations normalize. For long-term investors with 10-year horizons or longer, this elevated valuation suggests moderating return expectations and potentially adjusting portfolio risk, though expensive markets can remain expensive for extended periods before any correction occurs.
Shiller, R.J. (2025) Online Data Robert Shiller. Available at: http://www.econ.yale.edu/~shiller/data.htm (Accessed: 25 October 2025).
Conference Board Consumer Confidence Index
The Conference Board—a nonprofit research organization that tracks economic trends—reported that its Consumer Confidence Index (a measure of how optimistic Americans feel about the economy) declined to 94.2 in September, down from 97.8 in August. This represents the lowest reading since April 2025. The Present Situation Index (which measures how consumers view current business and job market conditions) fell sharply by 7.0 points to 125.4. Meanwhile, the Expectations Index (which gauges consumers' short-term outlook for income, business conditions, and job availability over the next six months) decreased slightly to 73.4. This expectations measure has remained below 80—a threshold that typically signals an approaching recession—for eight consecutive months since February 2025.
The Conference Board (2025) Consumer Confidence Index®. Available at: https://www.conference-board.org/topics/consumer-confidence/ (Accessed: 25 October 2025).
University of Michigan Consumer Sentiment
The University of Michigan Consumer Sentiment Index (a measure of how confident Americans feel about the economy and their personal finances) fell to 53.6 in October 2025, marking a five-month low. This represents the third consecutive monthly decline. The survey is conducted by the University of Michigan's Institute for Social Research and collects responses from 900-1,000 American households each month through web-based interviews. These households are randomly selected to represent all U.S. consumers. High prices and job market concerns remain the primary worries for respondents. Consumer expectations about future inflation (how much prices will rise) held at 4.6% for the year ahead, well above the Federal Reserve's 2% target rate, indicating Americans believe price increases will continue at elevated levels.
Surveys of Consumers, University of Michigan (2025) Consumer Sentiment Index - October 2025 Final. Available at: https://www.sca.isr.umich.edu/ (Accessed: 25 October 2025)
The AI Financing Architecture: Echoes of the Dot-Com Era
OpenAI Financial Snapshot (2025)
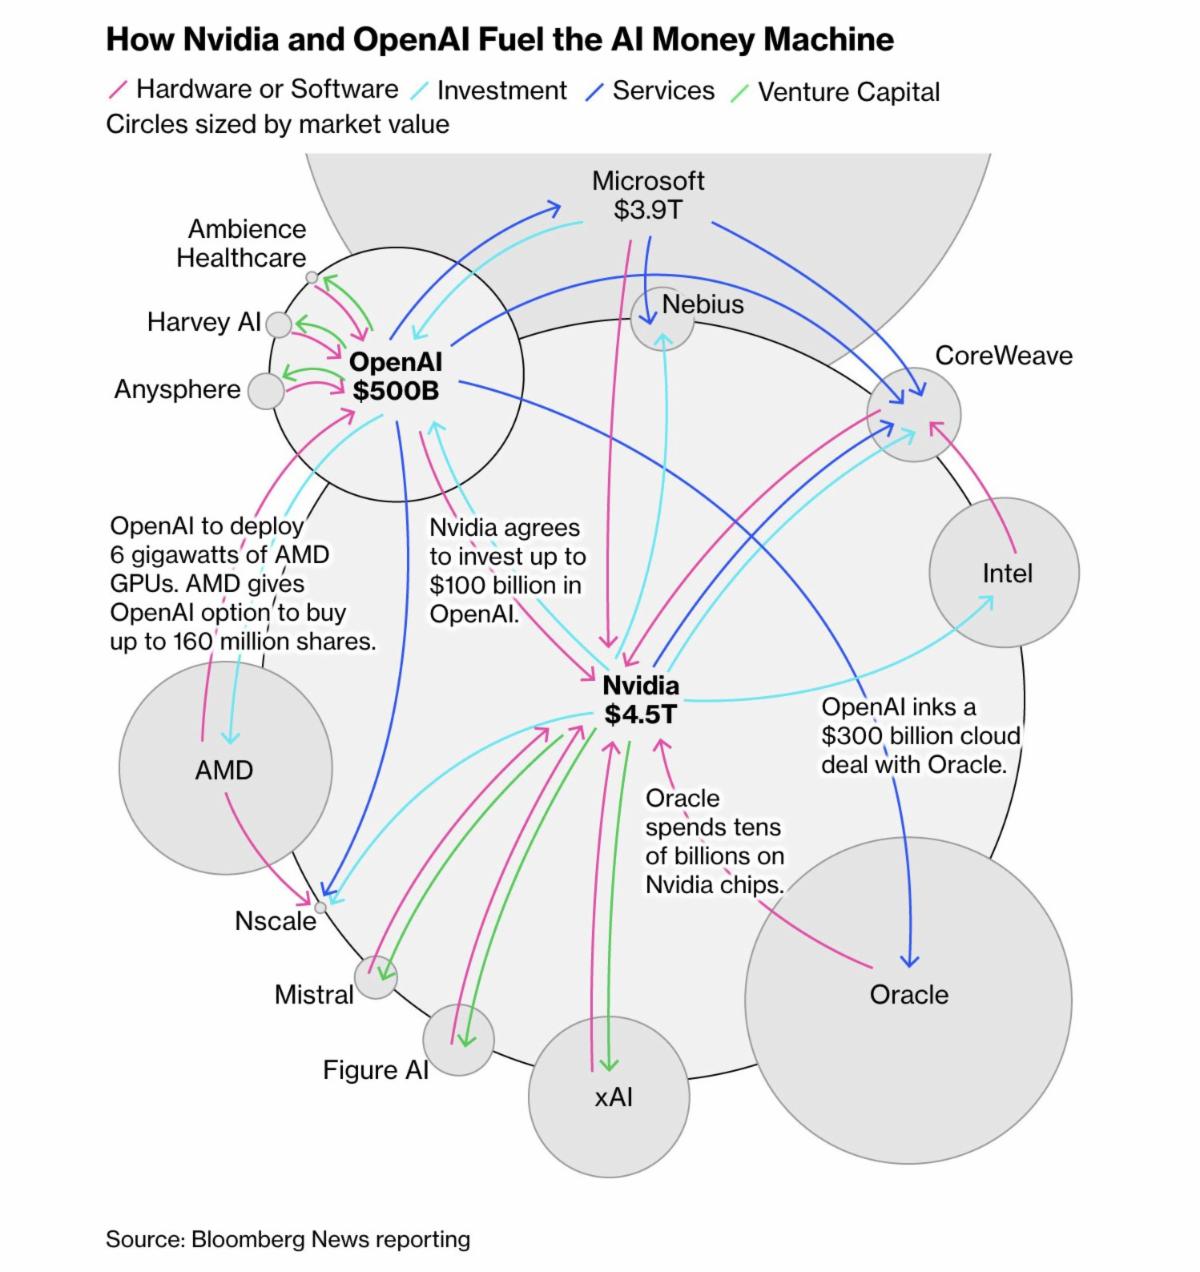
The financing architecture we're seeing in many AI companies is strikingly reminiscent of vendor financing schemes (arrangements where companies provide loans or credits to customers to purchase their own products) that characterized the late 1990s technology bubble. At the center sits OpenAI, valued at $500 billion despite generating only $13 billion in annual revenue—a company that has committed to spending approximately $880-930 billion on infrastructure across Oracle ($300B), Nvidia ($350B), AMD ($210B), CoreWeave ($22B), and Broadcom ($10B).
The circular flows are unmistakable: Nvidia commits up to $100 billion to invest in OpenAI, which then deploys those funds to purchase Nvidia chips at an estimated 3.5:1 ratio—$35 billion in chip purchases for every $10 billion invested. Oracle spends roughly $40 billion on Nvidia hardware to build Stargate datacenters, then signs a $300 billion cloud infrastructure deal with OpenAI. Meanwhile, Nvidia maintains a 6% stake in CoreWeave, which has contracted $22 billion with OpenAI while simultaneously holding $6.3 billion in capacity purchase commitments from Nvidia through 2032.
This bears uncomfortable parallels to vendor financing that inflated telecom and networking equipment revenues during the dot-com era, when companies like Cisco and Lucent effectively funded their own sales by providing financing to customers who then purchased their equipment. The critical difference: those 1990s arrangements at least had the courtesy of appearing on balance sheets as receivables (money owed to the company). Today's structure operates through equity stakes (ownership shares), capacity commitments (promises to purchase future services), and joint ventures—creating what Morgan Stanley describes as "insufficient disclosure of the circular structure" that makes it difficult for investors to assess true risk exposure.
OpenAI's aggregate commitments represent 175-185% of its entire company valuation and roughly 68-72x its current annual revenue. The company burned through $9.2 billion in the first half of 2025 alone ($6.7B R&D, $2.5B stock compensation) and won't reach cash flow positivity (generating more cash than it spends) until 2029 by its own projections. Yet public market capitalizations (total stock market values) have expanded dramatically on the announcement of these deals—AMD jumped $100 billion on the GPU supply agreement; Oracle approached the trillion-dollar threshold on the Stargate announcement.
The Bain & Company analysis crystallizes the fundamental mismatch: AI infrastructure spending will require $2 trillion in annual revenue by 2030 to justify current investment levels—an $800 billion shortfall when measured against projected AI revenue generation. OpenAI sits at the epicenter of this imbalance, with its partners' remaining performance obligations (RPOs—contracted revenue not yet delivered) now heavily concentrated around its future spending capacity. Oracle's and CoreWeave's RPOs are reportedly 67% and 40% dependent on OpenAI contracts respectively, according to Morgan Stanley estimates.
These interdependencies—where capital, equity, and purchase commitments flow in self-reinforcing loops—recall the systemic fragility that emerged when vendor-financed customers in the telecom sector began defaulting in 2001-2002. The question isn't whether OpenAI's technology is transformative; it's whether an AI company generating $13 billion annually can sustain $880+ billion in infrastructure commitments while burning $18+ billion per year operationally, or whether we're witnessing an elaborate mechanism for converting private company promises into public market capitalizations.
Analysis synthesized from Morgan Stanley Research (2025) and Bain & Company (2025) industry reports on AI infrastructure financing structures.
CME FedWatch Tool - Federal Reserve Meeting Probabilities
| CME FedWatch Tool - Conditional Meeting Probabilities | ||||||||||
|---|---|---|---|---|---|---|---|---|---|---|
| Meeting Date | 175-200 | 200-225 | 225-250 | 250-275 | 275-300 | 300-325 | 325-350 | 350-375 | 375-400 | 400-425 |
| 10/29/2025 | 0.0% | 0.0% | 0.0% | 0.0% | 98.3% | 1.7% | ||||
| 12/10/2025 | 0.0% | 0.0% | 0.0% | 0.0% | 0.0% | 0.0% | 0.0% | 91.1% | 8.8% | 0.1% |
| 1/28/2026 | 0.0% | 0.0% | 0.0% | 0.0% | 0.0% | 0.0% | 50.4% | 45.5% | 4.0% | 0.1% |
| 3/18/2026 | 0.0% | 0.0% | 0.0% | 0.0% | 0.0% | 25.8% | 47.9% | 24.3% | 2.0% | 0.0% |
| 4/29/2026 | 0.0% | 0.0% | 0.0% | 0.0% | 6.9% | 31.7% | 41.6% | 18.3% | 1.5% | 0.0% |
| 6/17/2026 | 0.0% | 0.0% | 0.0% | 3.9% | 20.8% | 37.2% | 28.5% | 8.8% | 0.6% | 0.0% |
| 7/29/2026 | 0.0% | 0.0% | 1.2% | 9.0% | 25.7% | 34.6% | 22.6% | 6.4% | 0.5% | 0.0% |
| 9/16/2026 | 0.0% | 0.4% | 4.0% | 15.1% | 29.0% | 30.3% | 16.7% | 4.2% | 0.3% | 0.0% |
| 10/28/2026 | 0.1% | 1.0% | 5.7% | 17.2% | 29.2% | 28.2% | 14.8% | 3.6% | 0.2% | 0.0% |
| 12/9/2026 | 0.2% | 1.7% | 7.5% | 19.1% | 29.0% | 26.1% | 13.1% | 3.1% | 0.2% | 0.0% |
Understanding This Data:
- This data shows market probabilities for Federal Reserve interest rate decisions at upcoming FOMC (Federal Open Market Committee) meetings
- Probabilities come from federal funds futures pricing—essentially, what traders are betting will happen with interest rates
- Each percentage shows the likelihood of rates being at that specific level after each meeting
- Blue highlighted cells show the highest probability for each meeting date
- These represent market expectations, not Federal Reserve official guidance or guarantees
- Probabilities are conditional, meaning they depend on all previous meeting outcomes happening as expected
The CME FedWatch Tool tracks market expectations for Federal Reserve interest rate changes using futures contracts (financial instruments that bet on future rates). Markets currently show 98.3% probability the Fed will cut rates to 3.75%-4.00% at the October 29, 2025 meeting, continuing the easing cycle (lowering rates to stimulate economic growth) that began in 2024. By December 2025, markets expect another cut bringing rates to 3.50%-3.75% with 91.1% probability. Throughout 2026, probabilities show gradual rate reductions as markets anticipate inflation cooling and economic softening.
CME Group (2025) CME FedWatch Tool. Available at: https://www.cmegroup.com/markets/interest-rates/cme-fedwatch-tool.html (Accessed: October 25, 2025)
Consumer Price Index (CPI)
The Consumer Price Index (CPI)—which measures how much everyday goods and services cost—rose 0.3% in September 2025, bringing the annual inflation rate to 3.0%. This report was delayed nine days due to the federal government shutdown but uses data collected before the shutdown began.
Core CPI (which excludes volatile food and energy prices) increased 0.2% monthly and held at 3.0% annually, showing persistent underlying price pressures.
Energy costs drove much of September's increase, with gasoline prices jumping 4.1%—the largest monthly gain since August 2023. Food prices rose 0.2%, while shelter costs (housing and rent) continued their steady climb, remaining the largest contributor to core inflation.
U.S. Bureau of Labor Statistics (2025) Consumer Price Index Summary - September 2025. Available at: https://www.bls.gov/news.release/cpi.nr0.htm (Accessed: October 24, 2025)
Housing Market Overview
Existing Home Sales (September 2025)
Existing home sales (sales of previously owned homes) reached 4.06 million on an annualized basis in September, marking a seven-month high as falling mortgage rates brought buyers back into the market. The median home price rose to $415,200, representing the 27th consecutive month of year-over-year price increases. Available inventory (the number of homes currently for sale) climbed to 1.55 million units, matching a five-year high, though still below pre-pandemic levels. First-time buyers accounted for 30% of purchases, up from 26% a year ago, suggesting improved affordability conditions are helping entry-level buyers enter homeownership.
NAHB Housing Market Index (October 2025)
The NAHB Housing Market Index (a measure of home builder confidence in the market for newly built single-family homes) rose to 37 in October from 32 in September, reaching its highest level since April. The index ranges from 0 to 100, where readings above 50 indicate more builders view conditions as good rather than poor. Builder optimism improved significantly regarding future sales expectations, which jumped nine points to 54—the only component above the neutral 50 threshold. This suggests builders anticipate improving market conditions over the next six months as mortgage rates (the interest rates charged on home loans) declined from 6.5% to approximately 6.19% as of October 24, with further Federal Reserve rate cuts expected to enhance affordability for potential homebuyers.
Market Context: The housing market is showing signs of stabilization as mortgage rates retreat from earlier highs. The 4.6-month supply of inventory approaches the balanced market range of 4.5 to 6 months, indicating neither strong buyer nor seller advantage. However, affordability remains constrained with 38% of builders cutting prices in October (averaging 6% reductions) and 65% offering sales incentives. Homes spent a median of 33 days on market, slightly longer than the 28 days recorded in September 2024, reflecting continued buyer caution despite improving conditions.
National Association of Realtors (2025) NAR Existing-Home Sales Report Shows 1.5% Increase in September. Available at: https://www.nar.realtor/newsroom/nar-existing-home-sales-report-shows-1-5-increase-in-september (Accessed: 25 October 2025)
Manufacturing & Business Activity
| Indicator | Current | Previous | Status |
|---|---|---|---|
| S&P Manufacturing PMI | 52.2 | 52.0 | Expanding |
| S&P Services PMI | 55.2 | 54.8 | Expanding |
| ISM Services PMI | 50.0 | 52.0 | Neutral |
| Empire State New Orders | 3.7 | -4.1 | Improving |
U.S. manufacturing activity presents mixed signals in October 2025. The S&P Global Composite PMI (a survey-based measure of business conditions across manufacturing and services) reached 54.8, its highest level since July, suggesting overall economic expansion. However, the ISM Manufacturing PMI (another measure of factory activity from the Institute for Supply Management) remained below 50 at 49.1 for the seventh consecutive month, indicating contraction in traditional manufacturing. Regional indicators diverged sharply: New York's Empire State Manufacturing Index surged to 10.7 from negative -8.7, while Philadelphia's index plummeted to -12.8 from 23.2, reflecting uneven manufacturing recovery. The services sector showed resilience with S&P Services PMI at 55.2, though ISM Services hit neutral at 50.0, its weakest reading since January 2010.
S&P Global (2025) S&P Global Flash U.S. PMI. Available at: https://www.pmi.spglobal.com/ (Accessed: October 25, 2025)
Disclosure
This material is provided by Todd Van Der Meid, MBA, CFP®, through Rhino Wealth Management, Inc., a Registered Investment Adviser, solely for informational purposes. It is not intended as investment, tax, legal, or accounting advice. Investors should consult qualified professionals before making financial decisions.
Opinions expressed herein are general in nature and not tailored to individual circumstances. Investment strategies discussed may not be suitable for every investor. All investments carry risk, including possible loss of principal, and past performance does not guarantee future results. No investment strategy or risk management technique ensures profit or eliminates risk in all market conditions.
Investments in foreign or emerging markets involve additional risks, such as currency fluctuations, geopolitical instability, and varying accounting standards. Sector-specific investments can be more volatile due to their concentrated nature. References to indexes are for illustrative purposes; indexes are unmanaged, cannot be invested into directly, and their performance does not reflect fees, expenses, or sales charges. Index performance is not indicative of specific investment performance.
Economic forecasts and forward-looking statements reflect current views and assumptions and are subject to change. Actual results may vary materially due to market or other conditions. There is no obligation to update forward-looking information.
Information presented herein comes from reliable third-party sources but is not guaranteed for accuracy or completeness. Rhino Wealth Management, Inc. disclaims liability for errors or omissions. Portions of this content may be generated using advanced analytical tools, including artificial intelligence, and all such content has been reviewed and validated by Todd Van Der Meid, MBA, CFP®, using proprietary quality-control measures. Rhino Wealth Management, Inc. does not directly hold securities; however, securities mentioned may be included within recommended portfolio models or held by clients. Please refer to our Form ADV for additional details regarding potential conflicts of interest.