


Powell Says Nothing, Markets Hear Everything
The S&P 500 edged up 0.27% this week as investors sifted through mixed economic signals, appearing more interested in future possibilities than current realities. Next week delivers two key data points that could shape September rate cut expectations: the revised Q2 GDP estimate on Thursday and the Fed's preferred inflation gauge—the PCE (Personal Consumption Expenditures) deflator—on Friday.
Both reports have the potential to either strengthen or undermine the case for lower rates, making this a pivotal week for anyone trying to decode what the Fed might actually do versus what markets hope they'll do.
Summary
Fed Chair Jerome Powell spoke at the Federal Reserve's annual economic symposium in Jackson Hole, Wyoming this Friday, and while he artfully said nothing definitive about September rate cuts, markets heard exactly what they wanted to hear. Powell acknowledged the obvious—job growth has slowed, and inflation remains above target—but stopped short of any promises. Yet market participants are betting heavily on a quarter-point cut anyway, essentially reading between the lines of his carefully crafted Fed-speak.
The economic data we're seeing tells a clearer story than Powell's diplomatic words. The labor market continues its gradual cooldown, with unemployment claims rising and job seekers finding it harder to land new positions. As economists have coined it, the "don't hire, don't fire" economy. Housing markets are showing clear signs of shifting toward a buyer's market, with inventory climbing and price growth essentially stalled. Meanwhile, leading economic indicators from the Conference Board keep flashing warning signals about the months ahead.
What's telling is how markets filled in the blanks Powell left empty. While he avoided commitments, market participants interpreted his tone and emphasis as a green light for September action. For investors and consumers, this creates both opportunity and uncertainty—but the biggest uncertainty remains whether Powell will actually deliver what markets think they heard.
This Week's Market and Economic Headlines
Economic Indicators Point to Continued Headwinds
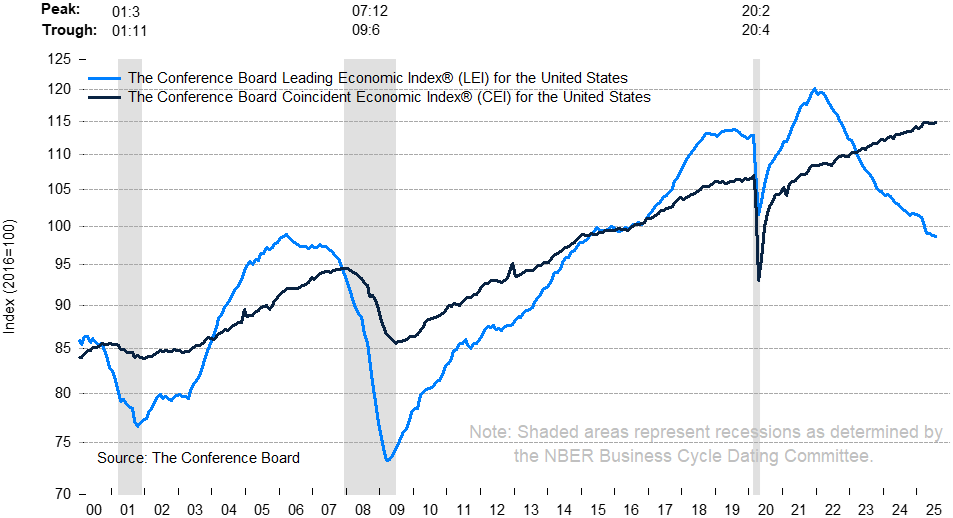
The Conference Board—the nonpartisan research group tracking economic trends since 1916—released their monthly Leading Economic Index this week, showing continued economic deterioration. Their key indicator fell 0.1% in July to 98.7, marking a 2.7% decline over six months and triggering their recession warning signal again. The details reveal mounting pressure across the economy. Consumer expectations remain deeply pessimistic, manufacturing new orders keep weakening, and building permits are sliding. While stock prices provided some support and unemployment claims improved, these positives weren't enough to offset the broader weakness.
Here's the key risk: The Conference Board expects economic growth to slow significantly in the second half of this year as tariff effects intensify. They're projecting GDP growth of just 1.6% for 2025, dropping to 1.3% in 2026. If new orders and housing don't stabilize soon, these already modest growth forecasts could come under serious pressure.
Source: The Conference Board, "The Conference Board Leading Economic Index® (LEI) for the US Fell Slightly in July," press release, Aug. 21, 2025.
The NAHB/Wells Fargo Housing Market Index slipped to 32 in August, down from 33 in July. The index measures builder sentiment on current sales, future sales expectations, and buyer traffic. A reading above 50 indicates more builders see conditions as good than poor; below 50 signals the opposite. At 32, the index shows confidence remains deeply negative, now for the 16th straight month. High mortgage rates and affordability challenges remain the central drag, while builders continue leaning on price cuts and sales incentives to keep buyers engaged.
Source: National Association of Home Builders, Housing Market Index – August 2025
The July New Residential Construction Report from the U.S. Census Bureau and HUD showed a mixed picture. Housing starts rose 5.2% to a 1.43 million annual pace, while permits fell 2.8% to 1.35 million. Think of starts as today’s activity and permits as tomorrow’s pipeline—builders are finishing projects already in motion but remain cautious about what comes next. Single-family construction barely budged, with starts up 2.8% and permits up just 0.5%. Most of the overall increase came from multifamily projects, likely delayed developments rather than a surge in new demand. Bottom line: Builders look to be working through backlogs instead of launching new projects. With mortgage rates still high, the market feels like it’s recalibrating more than recovering. Buyers should see more supply and negotiating leverage ahead.
Source: U.S. Census Bureau and U.S. Department of Housing and Urban Development (2025), New Residential Construction – July 2025
The NAR Existing Home Sales Report for July revealed a market gradually shifting to a buyers market. Sales ticked up 2.0% to 4.01 million units annually, while more significant changes emerged in pricing and inventory dynamics. Home price growth has essentially stalled, with the median price rising just 0.2% year-over-year to $422,400—the smallest increase since June 2023. Meanwhile, inventory jumped 15.7% from last year to 1.55 million homes, reaching levels not seen since the early pandemic. This combination creates the best negotiating environment for buyers in over five years. With 4.6 months of supply available and homes sitting on the market for 28 days (up from 24 last year), sellers are increasingly offering concessions. The regional picture tells an even clearer story: home prices actually declined in the South and West, the markets that saw the biggest gains during the pandemic boom. For prospective buyers who've been waiting on the sidelines, these trends suggest the market is finally moving toward more balanced conditions.
Source: National Association of Realtors, "Existing Home Sales Report," August 21, 2025.
The Unemployment Insurance Weekly Claims Report for this week continues the theme we've been tracking—the labor market is cooling, but it's happening gradually rather than dramatically. Initial claims ticked up by 11,000 to 235,000, which was a bit higher than expected and marks the biggest weekly jump we've seen since late May. But the real story is in continuing claims, which climbed to 1.97 million—the highest we've seen since late 2021. That's telling us something important: people who lose their jobs are having a much harder time finding new ones. We're seeing exactly what economists have been calling the "no hiring, no firing" economy. Companies aren't rushing to lay people off, but they're also not eager to bring on new workers. It's creating this strange dynamic where the unemployment rate stays relatively stable, but anyone actually looking for work is finding it tougher going.
Source: U.S. Department of Labor
By The Numbers
Employment Indicators
Employment data helps gauge whether consumers have jobs and money to spend. Consumer spending accounts for more than 70% of GDP.
| Indicator | Current Value | Status |
|---|---|---|
| Initial Claims for Unemployment | 235,000 | Stable |
| 4-Week Average of Initial Claims | 226,250 | Stable |
| 4-Week Average of Continuing Claims | 1.954M | Rising |
| Unemployment Rate | 4.2% | Rising |
Note: Values above 250K for the 4-Week Average, combined with rising unemployment, could signal a weakening economy.
Next unemployment report: September 5, 2025. Source: Department of Labor
Economic Growth (Real GDP)
| Period | Growth Rate | Status |
|---|---|---|
| Q4 2024 | 2.4% | Slowing |
| Q1 2025 | -0.5% | Contraction - Consider the average of Q1 & Q2 due to tariff distortions = 1.25% |
| Q2 2025 | 3.0% | Recovery - Consider the average of Q1 & Q2 due to tariff distortions = 1.25% |
| Q3 2025 (est.) | 2.3% | Slowing |
GDP growth provides a broad measure of overall economic activity and signals whether the economy is expanding or contracting.
Source: Bureau of Economic Analysis; Estimate from Federal Reserve Bank of Atlanta
Inflation Measures (CPI Year-over-Year)
| Month | Rate | Trend |
|---|---|---|
| September | 2.44% | Improving |
| October | 2.60% | Deteriorating |
| November | 2.75% | Deteriorating |
| December | 2.89% | Deteriorating |
| January 2025 | 3.00% | Deteriorating |
| February | 2.82% | Improving |
| March | 2.39% | Improving |
| April | 2.31% | Improving |
| May | 2.35% | Deteriorating |
| June | 2.67% | Deteriorating |
| July | 2.70% | Deteriorating |
| August (est.) | 2.84% | Deteriorating |
Source: Bureau of Labor Statistics; Estimate from Federal Reserve Bank of Cleveland
Note: While inflation has moderated, new tariffs may cause temporary spikes in monthly data. Once tariffs have been in place for a full year, inflation should revert closer to the underlying trend.
| CME FedWatch Tool - Conditional Meeting Probabilities | |||||||||||
|---|---|---|---|---|---|---|---|---|---|---|---|
| Meeting Date | 175-200 | 200-225 | 225-250 | 250-275 | 275-300 | 300-325 | 325-350 | 350-375 | 375-400 | 400-425 | 425-450 |
| 9/17/2025 | 0.0% | 0.0% | 0.0% | 0.0% | 75.0% | 25.0% | |||||
| 10/29/2025 | 0.0% | 0.0% | 0.0% | 0.0% | 0.0% | 0.0% | 0.0% | 0.0% | 35.3% | 51.5% | 13.3% |
| 12/10/2025 | 0.0% | 0.0% | 0.0% | 0.0% | 0.0% | 0.0% | 0.0% | 25.4% | 46.9% | 24.0% | 3.7% |
| 1/28/2026 | 0.0% | 0.0% | 0.0% | 0.0% | 0.0% | 0.0% | 10.7% | 34.4% | 37.3% | 15.5% | 2.2% |
| 3/18/2026 | 0.0% | 0.0% | 0.0% | 0.0% | 0.0% | 5.6% | 23.2% | 35.9% | 25.7% | 8.4% | 1.0% |
| 4/29/2026 | 0.0% | 0.0% | 0.0% | 0.0% | 1.9% | 11.5% | 27.4% | 32.6% | 20.0% | 6.0% | 0.7% |
| 6/17/2026 | 0.0% | 0.0% | 0.0% | 1.1% | 7.6% | 21.0% | 30.5% | 25.0% | 11.6% | 2.8% | 0.3% |
| 7/29/2026 | 0.0% | 0.0% | 0.4% | 3.2% | 11.9% | 24.1% | 28.8% | 20.7% | 8.8% | 2.0% | 0.2% |
| 9/16/2026 | 0.0% | 0.1% | 1.5% | 6.7% | 16.8% | 26.0% | 25.5% | 15.9% | 6.1% | 1.3% | 0.1% |
| 10/28/2026 | 0.0% | 0.4% | 2.5% | 8.7% | 18.6% | 25.9% | 23.6% | 14.0% | 5.1% | 1.0% | 0.1% |
| 12/9/2026 | 0.1% | 0.8% | 3.8% | 10.7% | 20.1% | 25.4% | 21.7% | 12.2% | 4.3% | 0.8% | 0.1% |
Understanding This Data:
- This data shows market probabilities for Fed rate decisions
- Probabilities come from federal funds futures pricing
- Each percentage shows likelihood of rates at that level after each meeting
- Blue highlighted cells show highest probability for each meeting
- These are market expectations not Federal Reserve guidance
- Probabilities depend on all previous meeting outcomes
Source: CME Group FedWatch Tool
Data Extracted: August 22, 2025 at 11:45 PM
Note: Data is subject to market conditions and changes continuously. Please verify current probabilities at CME Group's website.
| Date | 2025 Earnings Estimate | 2026 Earnings Estimate | Trend |
|---|---|---|---|
| June 28, 2024 | $276.29 |
|
|
| Sept 30, 2024 | $274.73 |
|
Deteriorating |
| Dec 31, 2024 | $271.25 |
|
Deteriorating |
| Mar 31, 2025 | $266.39 | $304.89 | Deteriorating |
| June 30, 2025 | $255.29 | $295.32 | Deteriorating |
| Current | $258.35 | $300.57 | Stable |
Source: S&P Dow Jones Indices
Disclosure:
This material is provided by Todd Van Der Meid, MBA, CFP®, through Rhino Wealth Management, Inc., a Registered Investment Adviser, solely for informational purposes. It is not intended as investment, tax, legal, or accounting advice. Investors should consult qualified professionals before making financial decisions.
Opinions expressed herein are general in nature and not tailored to individual circumstances. Investment strategies discussed may not be suitable for every investor. All investments carry risk, including possible loss of principal, and past performance does not guarantee future results. No investment strategy or risk management technique ensures profit or eliminates risk in all market conditions.
Investments in foreign or emerging markets involve additional risks, such as currency fluctuations, geopolitical instability, and varying accounting standards. Sector-specific investments can be more volatile due to their concentrated nature. References to indexes are for illustrative purposes; indexes are unmanaged, cannot be invested into directly, and their performance does not reflect fees, expenses, or sales charges. Index performance is not indicative of specific investment performance.
Economic forecasts and forward-looking statements reflect current views and assumptions and are subject to change. Actual results may vary materially due to market or other conditions. There is no obligation to update forward-looking information.
Information presented herein comes from reliable third-party sources but is not guaranteed for accuracy or completeness. Rhino Wealth Management, Inc. disclaims liability for errors or omissions. Portions of this content may be generated using advanced analytical tools, including artificial intelligence, and all such content has been reviewed and validated by Todd Van Der Meid, MBA, CFP®, using proprietary quality-control measures.
Rhino Wealth Management, Inc. does not directly hold securities; however, securities mentioned may be included within recommended portfolio models or held by clients. Please refer to our Form ADV for additional details regarding potential conflicts of interest.