

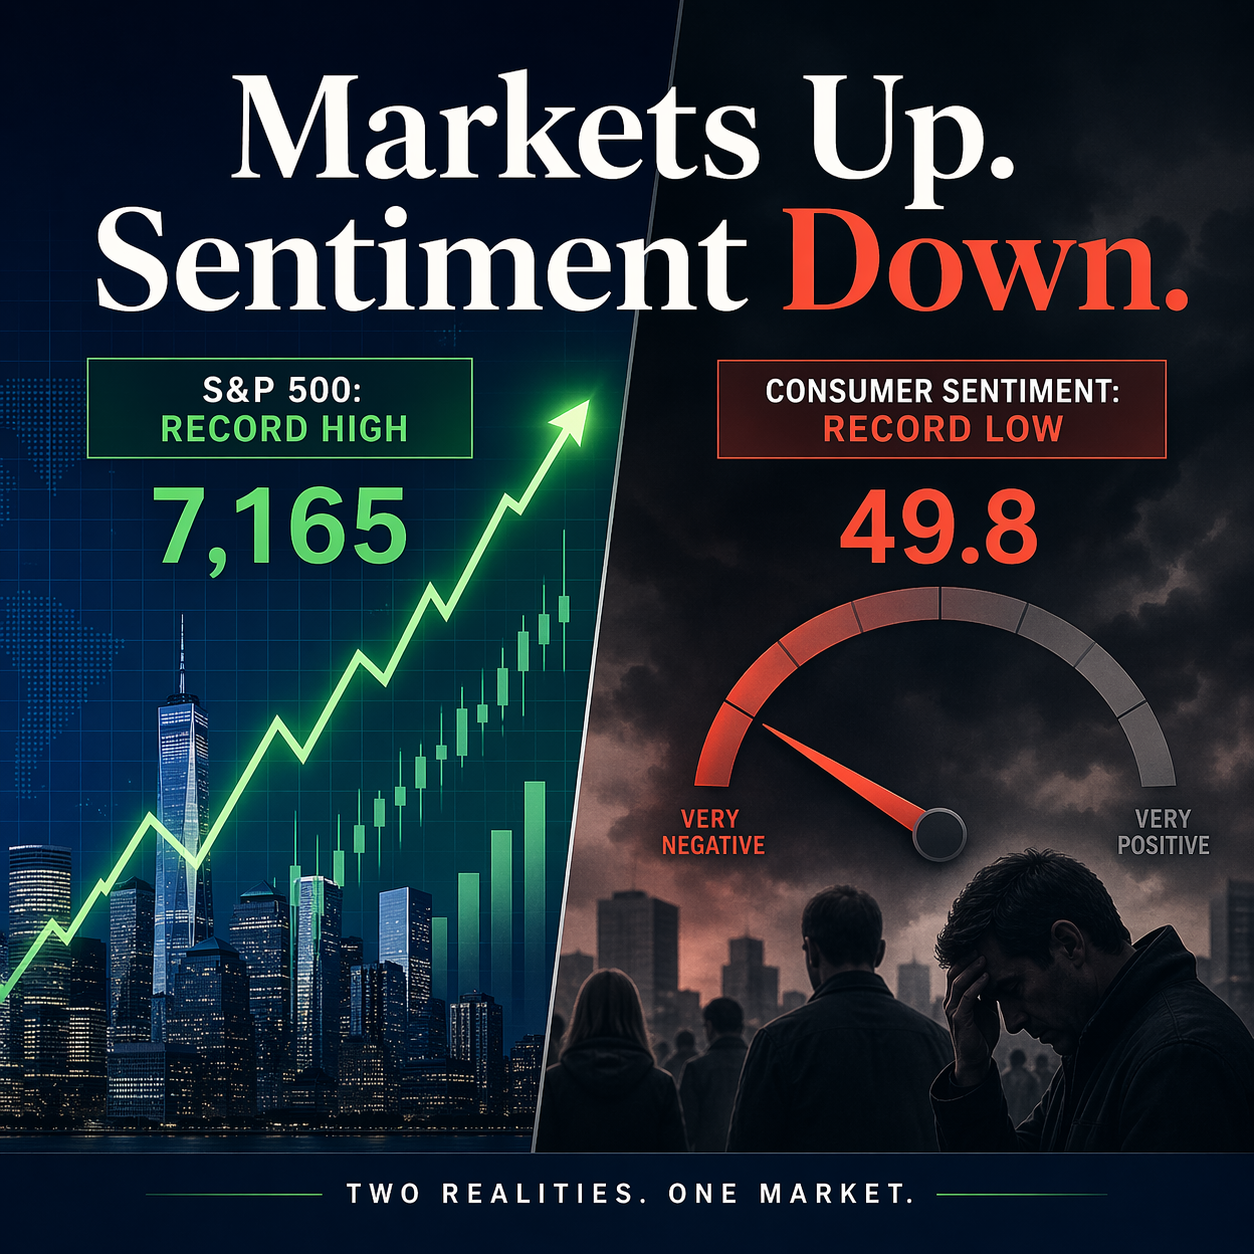
Record Highs, Record Lows
The S&P 500 finished the week up 0.55% to close at 7,165, a new all-time high and its fourth consecutive weekly gain. On the same day, the University of Michigan's final consumer sentiment reading for April came in at 49.8, the lowest number ever recorded in the survey's history going back to 1952. Same day. Stock market at an all-time high. Consumer sentiment at an all-time low. The tension between those two facts is worth exploring.
Glossary of Terms
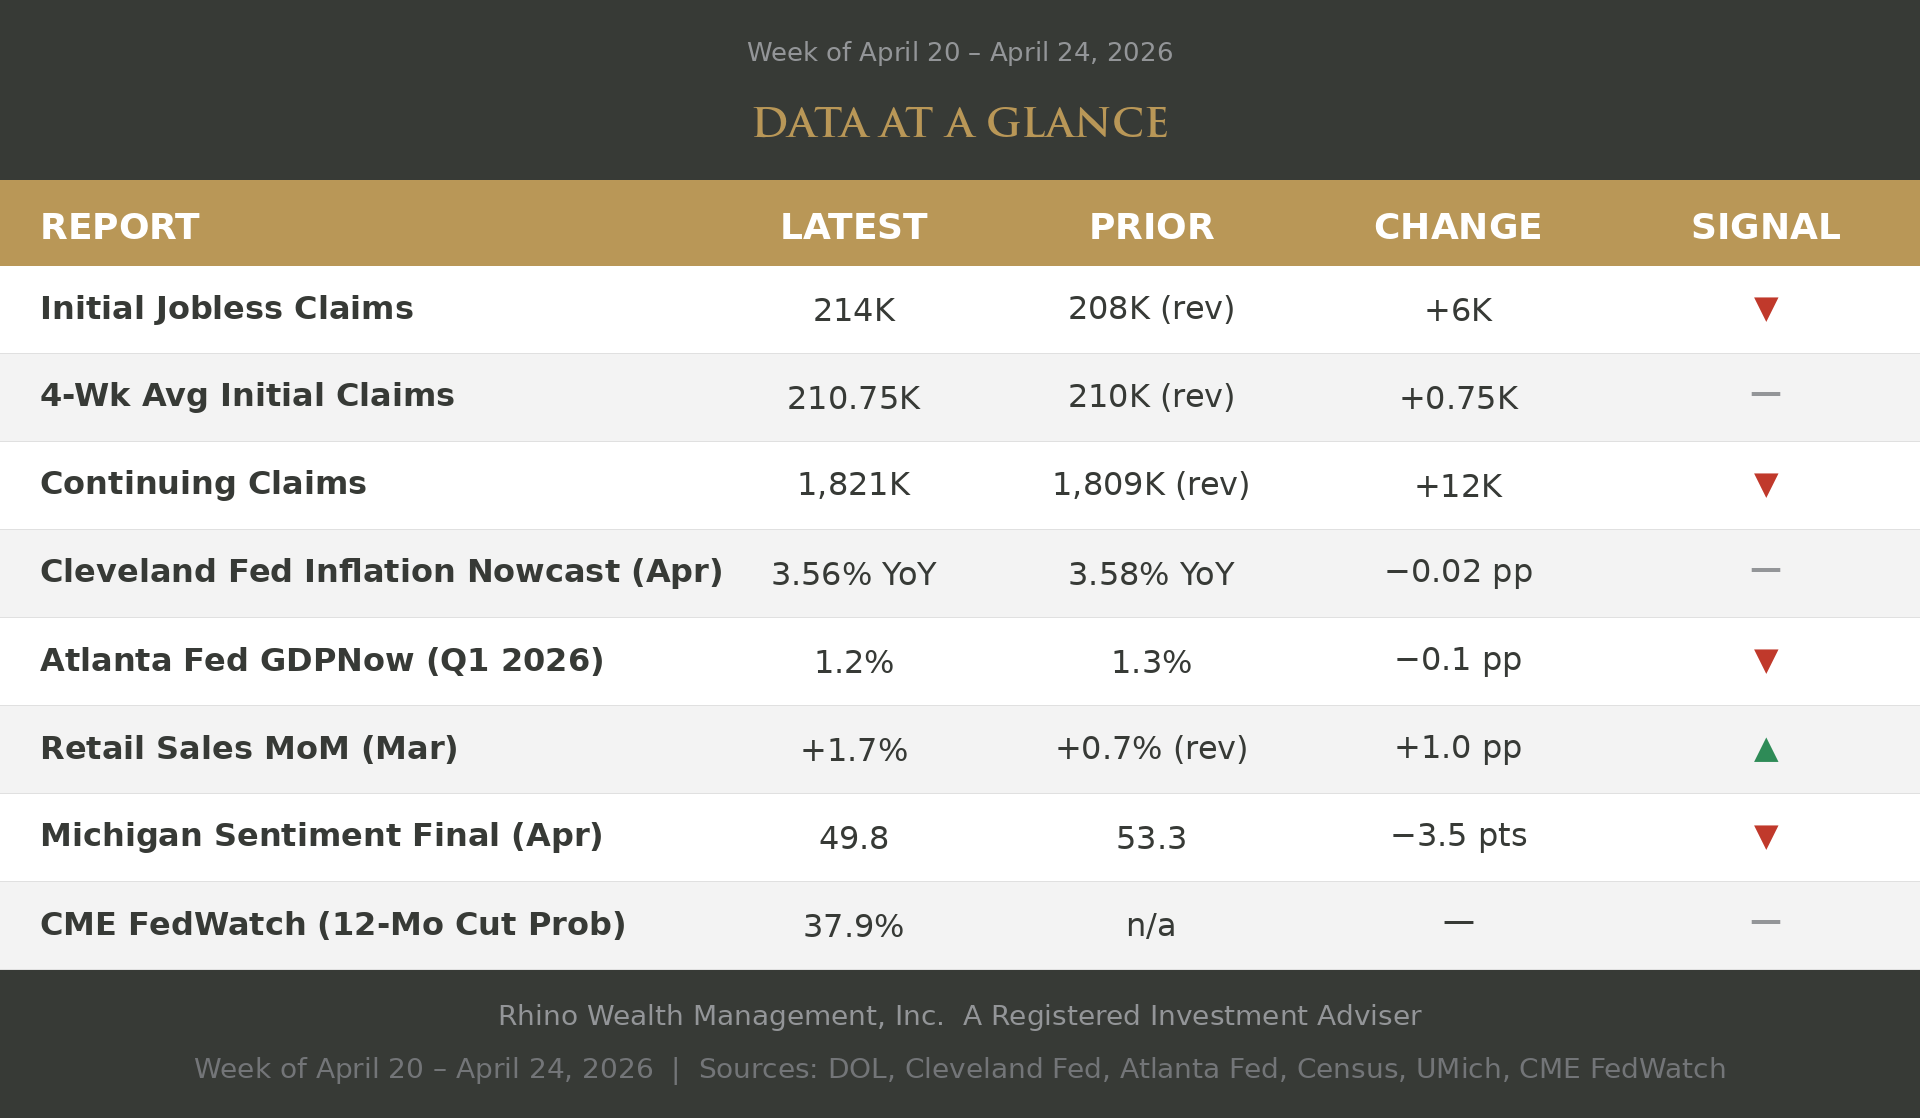
Initial Jobless Claims (214K) — The number of people who filed for unemployment benefits for the first time last week. It's one of the freshest reads on the job market because it's released every Thursday. Rising claims suggest employers are letting more workers go; falling claims suggest a tighter labor market. Source: U.S. Department of Labor.
4-Week Average Initial Claims (210.75K) — A four-week rolling average of initial jobless claims. Smooths out weekly noise (holidays, weather, one-off layoffs) to reveal the underlying trend in layoffs. Source: U.S. Department of Labor.
Continuing Claims (1,821K) — The number of people still receiving unemployment benefits after their initial filing. Reported with a one-week lag. When continuing claims rise, it suggests the unemployed are having a harder time finding new work — a signal of labor market slack. Source: U.S. Department of Labor.
Cleveland Fed Inflation Nowcast — April (3.56% YoY) — An estimate of what April's Consumer Price Index (CPI) will show when officially released next month. The Federal Reserve Bank of Cleveland updates this daily using incoming data on gasoline prices, food prices, and other inputs. It's a forward-looking read on inflation trends. Source: Federal Reserve Bank of Cleveland.
Atlanta Fed GDPNow — Q1 2026 (1.2%) — An estimate of current-quarter U.S. GDP growth (annualized), updated as new economic data is released. Built by the Federal Reserve Bank of Atlanta, it's a real-time read on where growth is tracking before the official Commerce Department estimate is released. Source: Federal Reserve Bank of Atlanta.
Retail Sales — March (+1.7% MoM) — The monthly change in total sales at U.S. retailers and food service establishments. Consumer spending drives roughly 70% of the economy, so this is one of the most-watched indicators of consumer health. Source: U.S. Census Bureau.
University of Michigan Consumer Sentiment — April Final (49.8) — A monthly survey of U.S. households measuring how consumers feel about their personal finances, business conditions, and buying intentions. The "Final" reading incorporates the full month of survey responses; higher readings indicate more optimism. Historical neutral is around 85. Source: University of Michigan Survey of Consumers.
CME FedWatch (12-Mo Cut Prob — 37.9%) — The market-implied probability, derived from Fed Funds futures prices, that the Federal Reserve will cut interest rates at least once over the next twelve months. This week's value means futures traders are pricing in a 38% chance of a rate cut between now and late April 2027. Source: CME Group FedWatch Tool.
What markets are pricing in
Markets are pricing in a resolution to the Middle East conflicts and betting there will be little lasting economic impact. Whether that plays out remains to be seen. So far, first quarter earnings have been strong, with 28% of S&P 500 companies having reported and the index tracking a blended earnings growth rate of 15.1%, on pace for a sixth consecutive quarter of double-digit growth. When earnings beat expectations, money moves into equities. That is exactly what happened.
The facts on the ground are troubling. The Strait of Hormuz remains effectively closed to commercial shipping. Iran seized two cargo vessels and has conditioned a return to talks on the U.S. lifting its naval blockade. A new round of negotiations in Pakistan is possible, but a positive outcome is not guaranteed. Markets are pricing in resolution. What we actually have is a fragile and still-evolving standoff.
What the sentiment data is telling us
Consumer sentiment fell to 49.8 in April, the lowest reading in the survey's 74-year history. Year-ahead inflation expectations jumped to 4.7%, the largest one-month increase since April 2025. The decline was broad-based, cutting across every income level, every age group, and every political affiliation. Higher energy costs are squeezing budgets at the margins, and the uncertainty around how long that lasts is weighing on confidence.
The 49.8 reading puts current sentiment below the early months of the pandemic, below the depths of the 2008 financial crisis, and below anything recorded during the inflation surge of the early 1980s. That comparison deserves some context. In each of those prior episodes, the economic damage was severe and measurable: mass layoffs, collapsing housing markets, double-digit unemployment. Today, unemployment remains low, earnings are growing, and the economy is still expanding. What the sentiment reading is capturing is not a crisis. It is anxiety. Higher gas prices, uncertainty about the war, and unease about what comes next. Those feelings are real, but they are not a true reflection of current economic conditions.
The gap has a shelf life
A gap this wide between equity prices and consumer confidence does not usually stay wide for long. It closes. The question is which side moves. In the best case, the Iran conflict finds a durable resolution, oil retreats, energy prices ease, and consumers start feeling better while earnings hold up. That is the scenario markets are pricing. In the harder case, Hormuz stays closed long enough for the energy shock to work its way deeper into core inflation, consumer spending softens, and corporate guidance for the second half of the year disappoints. That is the scenario the sentiment data is suggesting.
Next week gives us two more pieces of evidence. The Q1 GDP report is due next week. Q4 2025 came in at just 0.5%, and Q1 2026 will tell us whether the underlying economy was already softening before the war's effects began showing up in full. The same week, five of the seven largest companies in the S&P 500 report earnings: Apple, Microsoft, Amazon, Alphabet, and Meta. Together they account for roughly a quarter of the entire index. What they say about the rest of the year matters more than the numbers themselves.
Takeaway
Two records set in the same week: the highest stock market close ever and the lowest consumer sentiment reading in modern history. History suggests they will not stay this far apart for long.
Disclosure
This material is provided by Todd Van Der Meid, MBA, CFP®, through Rhino Wealth Management, Inc., a Registered Investment Adviser, solely for informational purposes. It is not intended as investment, tax, legal, or accounting advice. Investors should consult qualified professionals before making financial decisions.
Opinions expressed herein are general in nature and not tailored to individual circumstances. Investment strategies discussed may not be suitable for every investor. All investments carry risk, including possible loss of principal, and past performance does not guarantee future results. No investment strategy or risk management technique ensures profit or eliminates risk in all market conditions.
Investments in foreign or emerging markets involve additional risks, such as currency fluctuations, geopolitical instability, and varying accounting standards. Sector-specific investments can be more volatile due to their concentrated nature. References to indexes are for illustrative purposes; indexes are unmanaged, cannot be invested into directly, and their performance does not reflect fees, expenses, or sales charges. Index performance is not indicative of specific investment performance.
Economic forecasts and forward-looking statements reflect current views and assumptions and are subject to change. Actual results may vary materially due to market or other conditions. There is no obligation to update forward-looking information.
Information presented herein comes from reliable third-party sources but is not guaranteed for accuracy or completeness. Rhino Wealth Management, Inc. disclaims liability for errors or omissions. Portions of this content may be generated using advanced analytical tools, including artificial intelligence, and all such content has been reviewed and validated by Todd Van Der Meid, MBA, CFP®, using proprietary quality-control measures. Rhino Wealth Management, Inc. does not directly hold securities; however, securities mentioned may be included within recommended portfolio models or held by clients. Please refer to our Form ADV for additional details regarding potential conflicts of interest.