

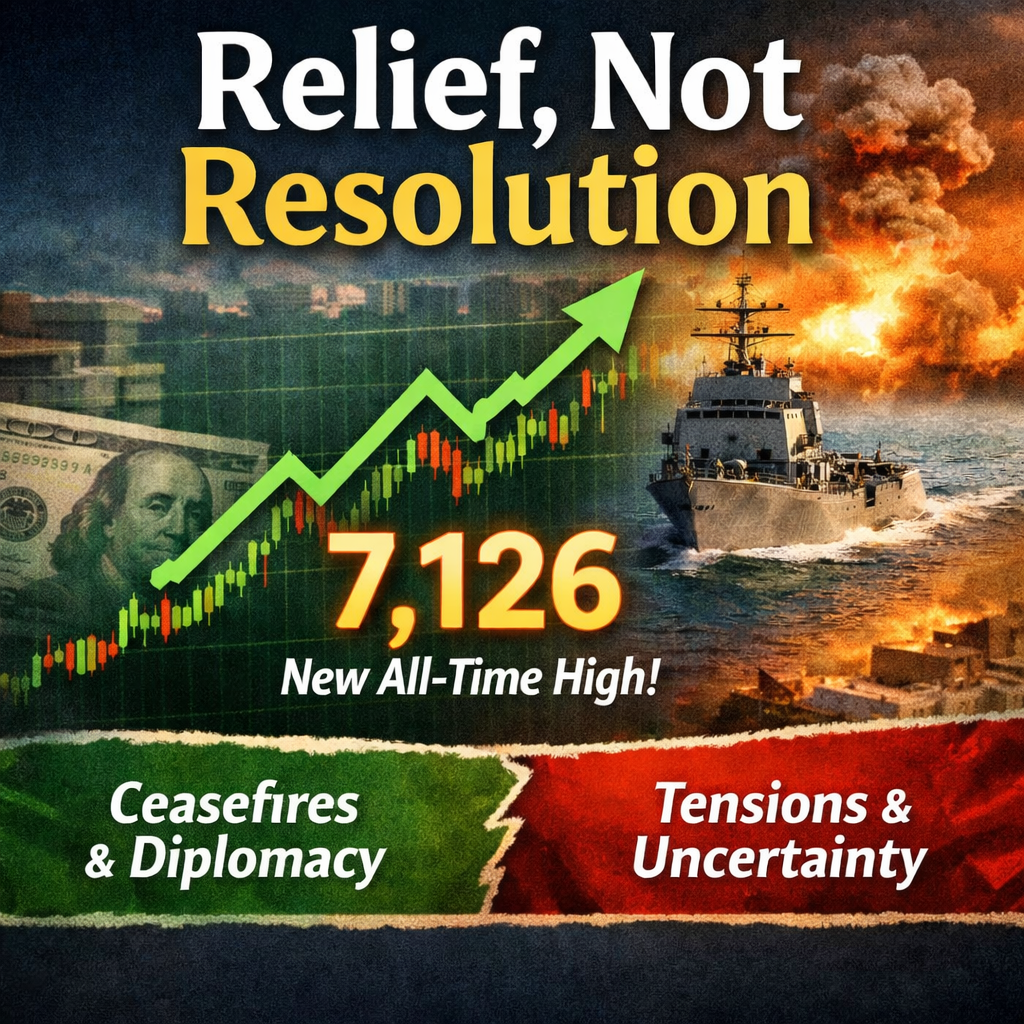
Relief, Not Resolution
The S&P 500 closed the week at 7,126, up 4.5% on the week and a fresh all-time high, posting its first-ever close above 7,000 as investors grew more confident that two of the geopolitical shocks weighing on markets this spring are moving toward resolution. The rally has come in spite of clear contradictions in the messaging out of Washington and Tehran. Iran's foreign minister declared the Strait of Hormuz "completely open" to commercial vessels for the duration of the Israel-Lebanon ceasefire, but with the caveat that ships must use a coordinated route cleared by Iranian forces. The White House countered that the US naval blockade on Iranian ports will stay in place until a peace deal is signed. The US-Iran truce that began April 8 is technically holding, but the Islamabad talks ended without an agreement, and officials on both sides are still negotiating whether a second round happens before the US-Iran truce expires April 22.
The more notable development was the United States helping broker a ten-day cessation of hostilities between Israel and Lebanon, with both governments agreeing to direct negotiations aimed at "lasting security, stability, and peace." Markets have historically been quick to price ceasefires as resolutions and slow to reprice when they unravel. Neither situation is settled, and the contradictions now on display are a reminder of how fragile both tracks remain. Still, after weeks of markets pricing worst-case outcomes on energy prices and regional escalation, even partial de-escalation is meaningful, and that is what this week's relief rally is telling us.
Glossary
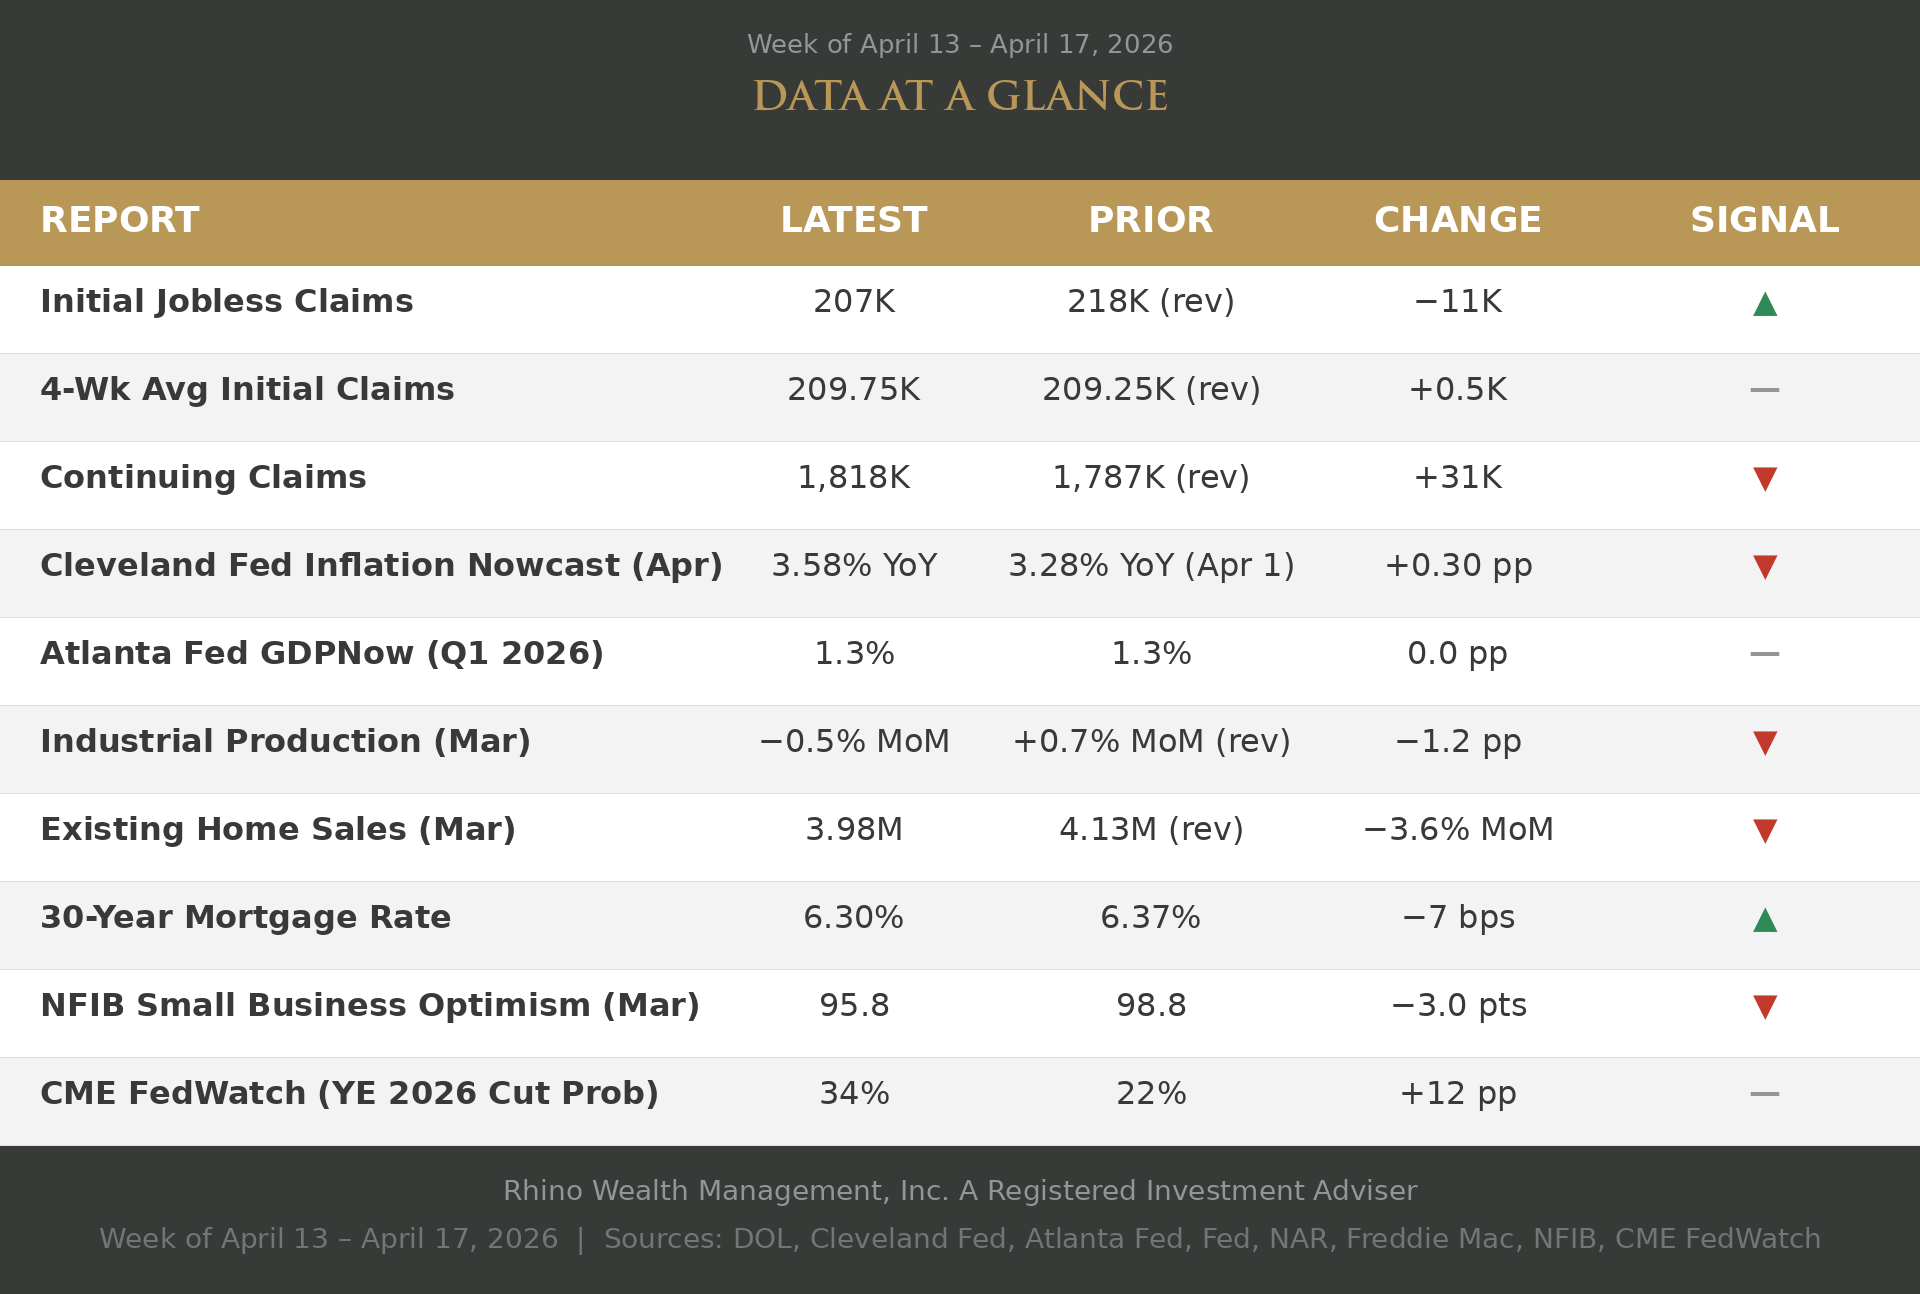
- Initial Jobless Claims — The number of people who filed for unemployment benefits for the first time during the week. A leading indicator of layoffs and labor market healt
- 4-Wk Avg Initial Claims — A four-week rolling average of initial unemployment claims that smooths out weekly volatility, giving a clearer picture of the underlying tren
- Continuing Claims — The number of people still receiving unemployment benefits after their first week. Reflects how quickly displaced workers are finding new job
- Cleveland Fed Inflation Nowcast — A daily-updated estimate of where consumer price inflation is right now, before the official monthly CPI report is released. Useful as an early read on inflation trend.
- Atlanta Fed GDPNow — A real-time forecast of U.S. economic growth (GDP) for the current quarter, updated as new data comes in. Indicates the pace of overall economic activit
- Industrial Production — Measures the total output of U.S. factories, mines, and utilities each month. A traditional gauge of how busy the goods-producing economy i
- Existing Home Sales — The number of previously owned homes sold during the month, reported as a seasonally adjusted annual rate. The primary measure of resale housing market activit
- 30-Year Mortgage Rate — The average interest rate on a conventional 30-year fixed-rate mortgage, surveyed weekly. Directly affects home affordability and monthly mortgage payment
- NFIB Small Business Optimism — A monthly index reflecting how optimistic small business owners feel about the economy. Captures Main Street sentiment, hiring plans, and capital spending intention
- CME FedWatch (YE 2026 Cut Prob) — The market-implied probability that the Federal Reserve will cut its benchmark interest rate at least once by the end of 2026, derived from Fed funds futures pricing. Reflects how investors expect monetary policy to evolve.
"In times like these, it helps to recall that there have always been times like these." — Paul Harvey
What History Suggests About the Rest of 2026
The current market environment has several historical precedents worth considering: equity indexes at record highs, oil prices elevated by a military conflict, consumer sentiment near its all-time low, and a Federal Reserve unable to cut or hike. The closest structural parallel is 1990, when Iraq's invasion of Kuwait doubled oil prices in a matter of weeks, tipping a late-cycle economy into a mild recession. Equities fell roughly 20% between July and October of that year, then rallied sharply once the conflict resolved and oil prices collapsed. The current Iran war dynamic is tracking a similar arc: a sharp selloff in March, followed by a rapid recovery on ceasefire hopes. The unresolved question is whether the conflict ends as decisively as the Gulf War did, because the speed of resolution is what separates the 1990 outcome (brief recession, strong recovery) from the 1973 outcome (prolonged energy shock, deep stagflation, a multi-year bear market in stocks). The March inflation data offers some encouragement on this front: core consumer prices rose just 0.2% for the month and core producer prices rose only 0.1%, suggesting the energy shock has not yet infected the broader price environment. But inflation expectations are flashing a warning, and whether that changes will depend heavily on what oil does from here.
There is also a well-documented calendar pattern at work. The second year of any presidential term, the midterm election year, has historically been the most volatile of the four-year cycle. The S&P 500's average intra-year drawdown during midterm years has been materially larger than in other years, with the weakest stretch typically running from mid-spring through early fall and the deepest point arriving around September or October. The mechanism is intuitive: midterm elections inject policy uncertainty, the president's party almost always loses seats, and investors reprice the legislative outlook. What makes this relevant today is that the current policy calendar aligns almost perfectly with the historical weak window. The Section 122 tariff authority expires in late July, the USMCA Joint Review begins July 1, and the midterm elections themselves are in November, meaning the three largest sources of policy uncertainty all cluster into the period where midterm-year volatility historically peaks.
The constructive offset is what tends to happen after. The six-month window following a midterm election has historically produced equity returns roughly double the average of all other periods. Once election results remove the uncertainty overhang, markets have repriced quickly and decisively to the upside, regardless of which party won. That pattern, combined with the possibility that the Iran conflict resolves and oil retreats toward pre-war levels, would set up a much more favorable environment for both equities and fixed income heading into 2027. The risk, of course, is that the energy shock persists long enough to broaden into core inflation, forcing the Fed into a tightening cycle that the economy cannot absorb, which is the 1973 scenario rather than the 1990 one. The April 30 GDP and inflation data will go a long way toward telling us which path we're on.
Takeaway
The record high deserves context. Markets are pricing partial de-escalation as if it were a settled peace, but both ceasefires are fragile and the headlines have moved faster than the underlying facts. A 7,126 close on the S&P 500 confirms that hope has returned. It does not confirm that the risks are behind us.
Disclosure
This material is provided by Todd Van Der Meid, MBA, CFP®, through Rhino Wealth Management, Inc., a Registered Investment Adviser, solely for informational purposes. It is not intended as investment, tax, legal, or accounting advice. Investors should consult qualified professionals before making financial decisions.
Opinions expressed herein are general in nature and not tailored to individual circumstances. Investment strategies discussed may not be suitable for every investor. All investments carry risk, including possible loss of principal, and past performance does not guarantee future results. No investment strategy or risk management technique ensures profit or eliminates risk in all market conditions.
Investments in foreign or emerging markets involve additional risks, such as currency fluctuations, geopolitical instability, and varying accounting standards. Sector-specific investments can be more volatile due to their concentrated nature. References to indexes are for illustrative purposes; indexes are unmanaged, cannot be invested into directly, and their performance does not reflect fees, expenses, or sales charges. Index performance is not indicative of specific investment performance.
Economic forecasts and forward-looking statements reflect current views and assumptions and are subject to change. Actual results may vary materially due to market or other conditions. There is no obligation to update forward-looking information.
Information presented herein comes from reliable third-party sources but is not guaranteed for accuracy or completeness. Rhino Wealth Management, Inc. disclaims liability for errors or omissions. Portions of this content may be generated using advanced analytical tools, including artificial intelligence, and all such content has been reviewed and validated by Todd Van Der Meid, MBA, CFP®, using proprietary quality-control measures. Rhino Wealth Management, Inc. does not directly hold securities; however, securities mentioned may be included within recommended portfolio models or held by clients. Please refer to our Form ADV for additional details regarding potential conflicts of interest.