

TACO to NACHO
The S&P 500 finished the week at 7,399, up 2.3%, closing at another record high.
Wall Street celebrated Cinco de Mayo this week.
Last year, the trade was TACO. This week, traders have a new one, NACHO.
TACO, short for Trump Always Chickens Out, was coined by Financial Times columnist Robert Armstrong in May 2025 to describe a pattern that kept repeating itself. Trump would announce tariffs. Markets would drop. Days later, he'd back off, and investors who held their nerve got paid. It worked often enough that it stopped being an observation and started being a strategy.
NACHO is different. Not A Chance Hormuz Opens. The term surfaced this week on trading desks and in Bloomberg commentary to describe a shift in how markets are thinking about the Strait of Hormuz, the narrow waterway that carries roughly 20% of the world's oil. The Strait has been effectively closed since U.S.-Israeli strikes on Iran began in late February, and the consensus is now that a quick fix isn't coming. Every ceasefire headline has triggered a drop in oil prices. The oil price keeps bouncing back. Marine insurance premiums for Hormuz transits are still about eight times their pre-war levels. Insurers price risk for a living, and they're not treating this as a short-term problem.
The difference between TACO and NACHO is the off-ramp. Tariffs are policy. Policy can reverse on a tweet. A closed military waterway does not reopen the same way. The market spent most of the spring trying to apply the TACO playbook to a conflict that doesn't follow the same rules. NACHO is the market acknowledging, finally, that it doesn't.
What makes this week interesting is that both trades are playing out at the same time. Analysts at State Street Global Advisors put it plainly: the S&P 500 is near all-time highs while Brent crude is still above $100 a barrel. Equities have held up because earnings have been genuinely strong. In Q1 2026, 84% of S&P 500 companies that have reported beat estimates, with blended earnings growth tracking at its highest rate since Q4 2021. Investors looking at corporate balance sheets are seeing strength the geopolitical headlines don't reflect.
Here's Where the Numbers Stand
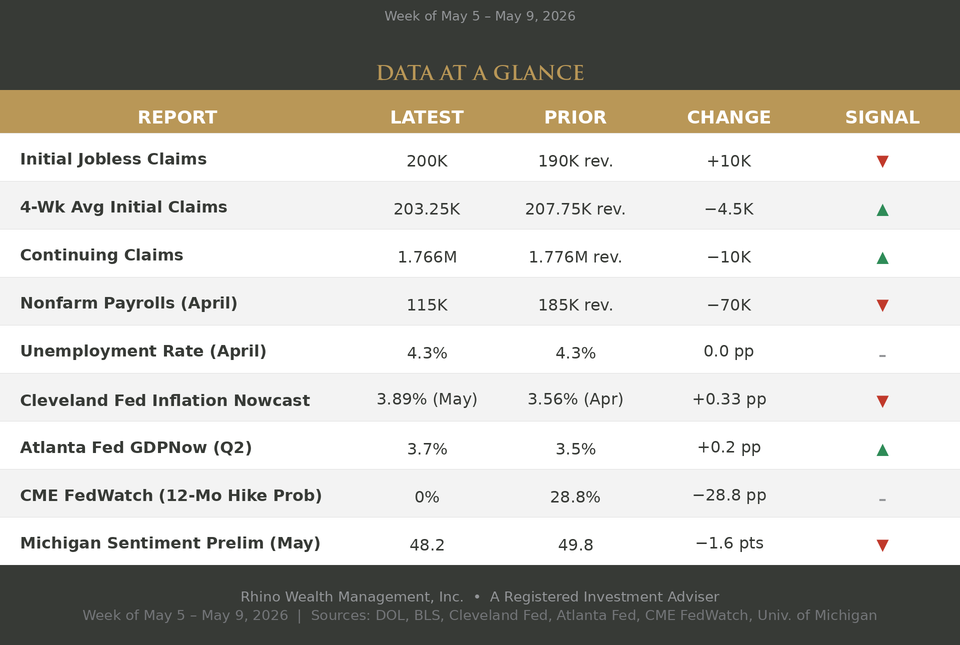
See glossary below for definitions of each metric.
The Labor Market Is Cooling
The April jobs report added 115,000 jobs, down from the revised 185,000 in March, with unemployment steady at 4.3%. The comparison to prior months matters less than where the number lands against a changed benchmark. The St. Louis Fed estimates breakeven employment growth for 2026 at just 15,000 to 87,000 jobs per month, down from roughly 150,000 a few years ago, as declining immigration has slowed labor force growth considerably. At 115,000, April clears that bar comfortably. Weekly claims supported the picture: initial claims rose to 200,000 but the four-week average fell to 203,250, and continuing claims edged down to 1.766 million. Layoffs remain contained, and the unemployment rate has barely moved despite months of headline numbers that look soft at first glance.¹
Inflation Is Still Climbing
The Cleveland Fed's Inflation Nowcast moved to 3.89% for May, up from 3.56% in April. Think of it as a model that estimates where headline inflation is heading before the official CPI report comes out.² Oil is the driver. Energy above $100 a barrel works its way into gas prices, shipping costs, and manufacturing inputs. Inflation doesn't need hot consumer demand to rise when energy is doing the work.
The Fed Is Stuck
Supply-side inflation in a tepid labor market leaves the Fed with nowhere to go. Raising rates into softening payrolls risks pushing unemployment higher. Cutting rates while energy is driving inflation back toward 4% risks making the problem worse. The Fed held rates steady at 3.5% to 3.75% at its April 28–29 meeting, likely Chair Jerome Powell's last before Kevin Warsh takes over, and the vote was a fractured 8-4, the most dissents since October 1992.³ Market pricing reflected the confusion: the 12-month rate hike probability on CME FedWatch dropped from 28.8% to essentially zero. Not because inflation is under control, but because the jobs data softened fast enough that the market no longer believes the Fed can justify tightening. If growth holds, unemployment stays contained, and inflation stays sticky, the Fed has little reason to move in either direction.
How People Feel About All of It
The University of Michigan's Consumer Sentiment Index fell to 48.2 in the preliminary May reading, down from 49.8 in April, a new all-time low in a survey that goes back to 1952.⁴ The disconnect is worth naming. Investors look forward. Consumers live in the current price level. A stock market rally is rational when investors decide the economy sidesteps the worst outcome. Weak sentiment is equally rational when households are still absorbing higher energy costs, insurance, and debt payments. Both things are true right now, and neither cancels the other out.
The Takeaway
The TACO trade built a habit: expect the worst won't happen, because it usually hasn't. NACHO is a correction to that habit. The Hormuz disruption isn't a tariff that can be walked back. Oil above $100 is the base case until there's a genuine resolution, and markets have largely stopped pretending otherwise.
That matters for how you read any rally from here. Buying the dip works when the dip is a policy reaction that can reverse. It's a harder case when the underlying risk is a closed waterway and a central bank with no clear path forward.
The resilience in equities is real. Earnings are strong. The Atlanta Fed's GDPNow, a real-time model tracking incoming data against current-quarter growth, has Q2 tracking at 3.7%.⁵ The labor market, while cooling, is not in freefall. But this week added cracks to the picture: a jobs miss on the old benchmark that isn't really a miss, a rising inflation nowcast, a divided Fed without a clear next move, and consumer sentiment at a generational low.
The menu has changed. NACHO is on it now, whether investors ordered it or not.
Glossary
- Initial Jobless Claims — Measures the number of people filing for unemployment benefits for the first time. It is a timely read on layoffs and labor-market stress. Source: DOL.
- 4-Wk Avg Initial Claims — Smooths weekly jobless-claims volatility by averaging the past four weeks. It helps show whether labor-market stress is trending higher or lower. Source: DOL.
- Continuing Claims — Measures the number of people still receiving unemployment benefits. It can indicate how easy or difficult it is for unemployed workers to find new jobs. Source: DOL.
- Nonfarm Payrolls — Measures monthly job creation across most U.S. employers. It is one of the primary indicators of labor-market strength. Source: BLS.
- Unemployment Rate — Measures the share of the labor force that is unemployed and actively looking for work. It is the most widely recognized labor-market gauge. Source: BLS.
- Cleveland Fed Inflation Nowcast — Estimates current inflation before official CPI data is released. It provides an early read on inflation direction, but it is still an estimate rather than an official inflation report. Source: Cleveland Fed.
- Atlanta Fed GDPNow — Estimates current-quarter real GDP growth using incoming economic data. It is a nowcast, not an official BEA GDP release. Source: Atlanta Fed.
- CME FedWatch — Uses Fed Funds futures pricing to estimate market-implied probabilities for future Federal Reserve policy rates. This week's row shows the 12-month probability of a rate hike. Source: CME FedWatch.
- Michigan Sentiment Prelim — Measures consumer attitudes about personal finances, business conditions, and the economy. It is a widely followed indicator of household confidence. Source: University of Michigan.
¹ Federal Reserve Bank of St. Louis, Breakeven Employment Growth Estimate Range Widens in 2026, March 2026; Bureau of Labor Statistics, Employment Situation Summary, May 2026. ² Federal Reserve Bank of Cleveland, Inflation Nowcasting, May 2026. ³ Federal Reserve, FOMC Statement, April 29, 2026. ⁴ University of Michigan, Surveys of Consumers, Preliminary May 2026. ⁵ Federal Reserve Bank of Atlanta, GDPNow, May 8, 2026.
Disclosure
This material is provided by Todd Van Der Meid, MBA, CFP®, through Rhino Wealth Management, Inc., a Registered Investment Adviser, solely for informational purposes. It is not intended as investment, tax, legal, or accounting advice. Investors should consult qualified professionals before making financial decisions.
Opinions expressed herein are general in nature and not tailored to individual circumstances. Investment strategies discussed may not be suitable for every investor. All investments carry risk, including possible loss of principal, and past performance does not guarantee future results. No investment strategy or risk management technique ensures profit or eliminates risk in all market conditions.
Investments in foreign or emerging markets involve additional risks, such as currency fluctuations, geopolitical instability, and varying accounting standards. Sector-specific investments can be more volatile due to their concentrated nature. References to indexes are for illustrative purposes; indexes are unmanaged, cannot be invested into directly, and their performance does not reflect fees, expenses, or sales charges. Index performance is not indicative of specific investment performance.
Economic forecasts and forward-looking statements reflect current views and assumptions and are subject to change. Actual results may vary materially due to market or other conditions. There is no obligation to update forward-looking information.
Information presented herein comes from reliable third-party sources but is not guaranteed for accuracy or completeness. Rhino Wealth Management, Inc. disclaims liability for errors or omissions. Portions of this content may be generated using advanced analytical tools, including artificial intelligence, and all such content has been reviewed and validated by Todd Van Der Meid, MBA, CFP®, using proprietary quality-control measures. Rhino Wealth Management, Inc. does not directly hold securities; however, securities mentioned may be included within recommended portfolio models or held by clients. Please refer to our Form ADV for additional details regarding potential conflicts of interest.