

The Rearview Mirror vs. the Windshield
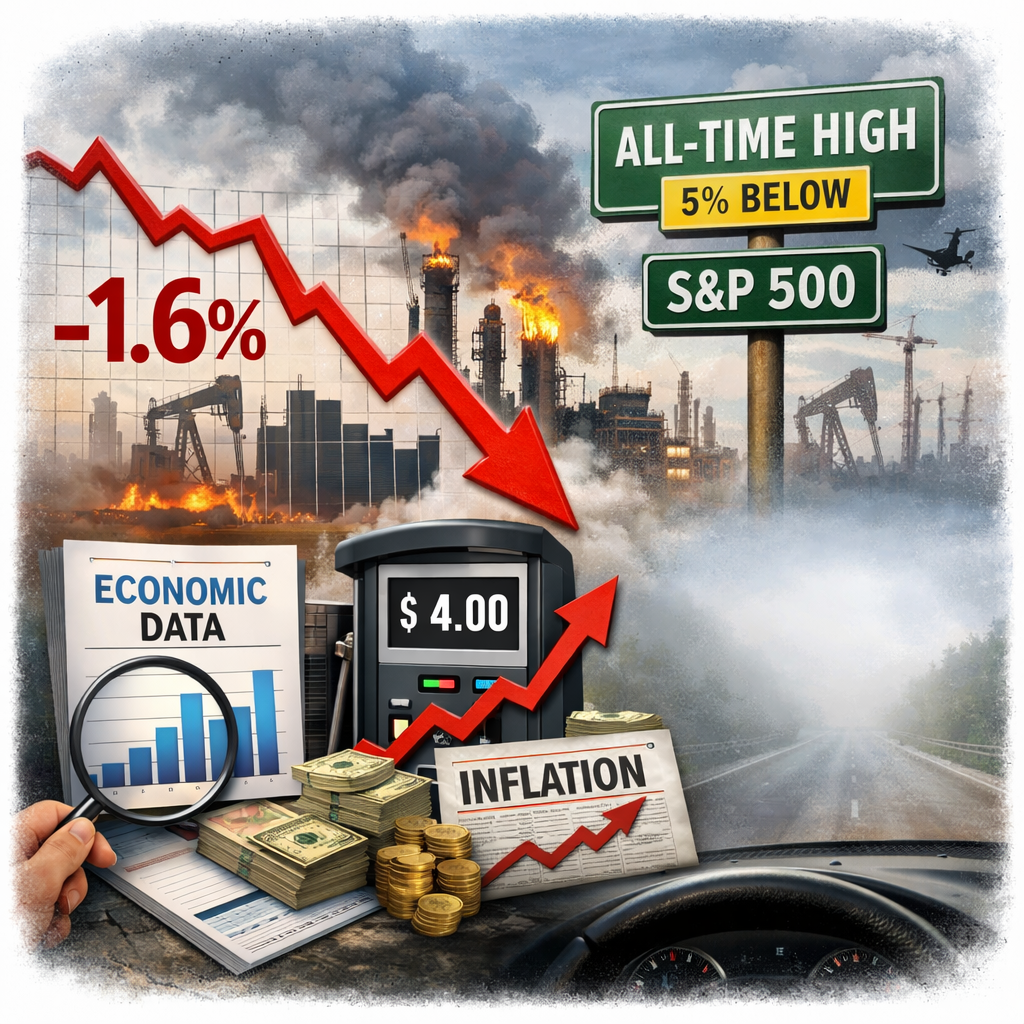
The S&P 500 closed down 1.6% this week, marking its third consecutive weekly decline. But context matters: despite the headlines, the index sits just 5% below its all-time high.
Two very different stories competed for attention this week. The first was a batch of economic data that, in normal times, would have dominated headlines on its own. The second was the ongoing conflict in Iran and its immediate impact on energy prices, consumer confidence, and the inflation outlook. Most of this week's official releases reflect an economy that was measured before the war began. The rearview mirror looks okay, but the windshield is foggier.
Glossary
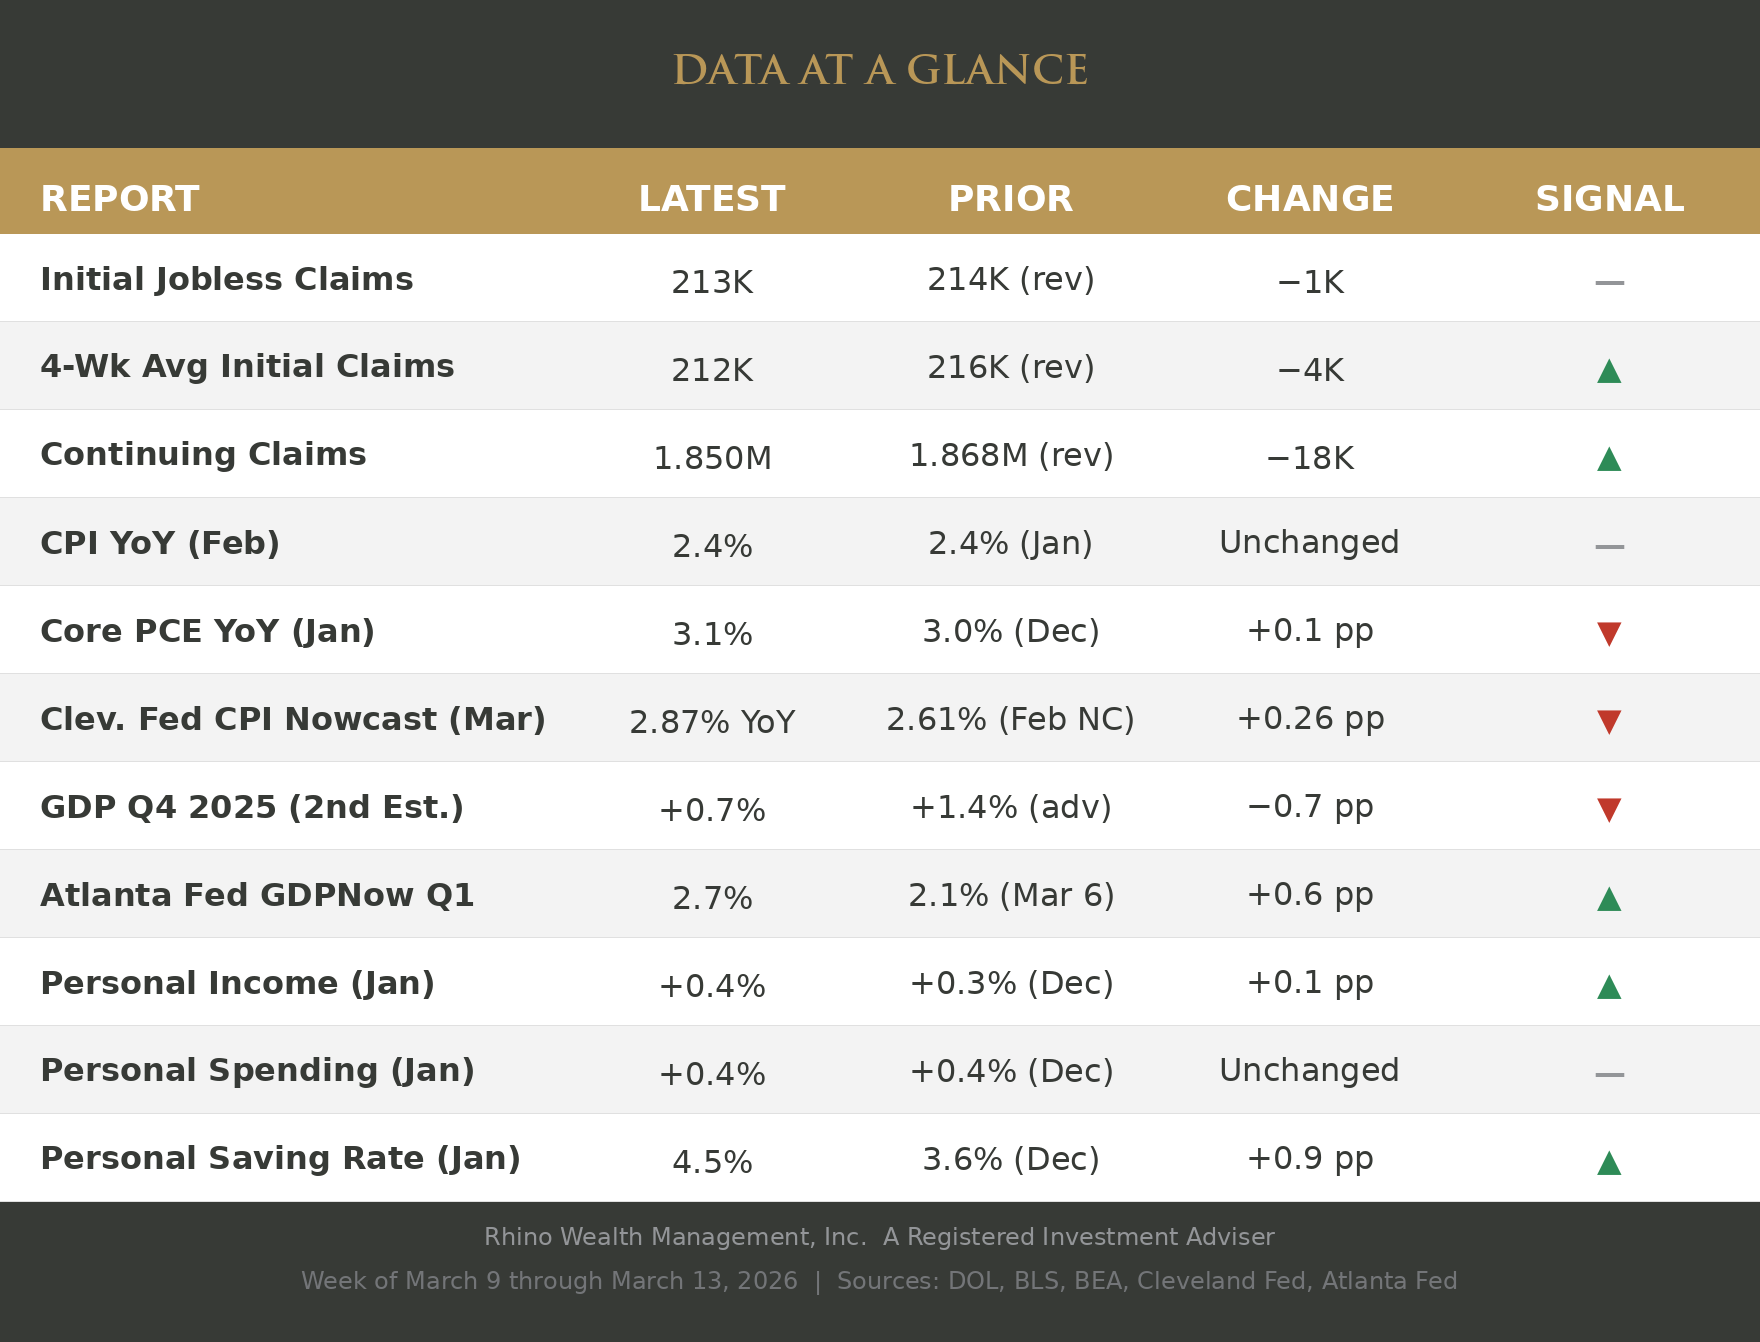
- Initial Jobless Claims — Number of people filing for unemployment benefits for the first time that week. Lower levels generally indicate fewer layoffs. (U.S. Department of Labor)
- 4-Week Average Initial Claims — A smoothed average of the last four weeks of initial claims, which reduces week-to-week noise and gives a clearer picture of the layoff trend. (U.S. Department of Labor)
- Continuing Claims — Total number of people still receiving unemployment benefits. Rising levels can indicate it is taking longer for people to find new work. (U.S. Department of Labor)
- CPI YoY — The Consumer Price Index measures year-over-year changes in prices paid by consumers for a broad basket of goods and services. It is one of the most widely followed measures of inflation. (Bureau of Labor Statistics)
- Core PCE YoY — The Personal Consumption Expenditures price index excluding food and energy. This is the Federal Reserve's preferred inflation gauge because it adjusts for changes in consumer behavior and covers a broader range of spending. (Bureau of Economic Analysis)
- Cleveland Fed CPI Nowcast — A daily model estimate of where the Consumer Price Index is headed before the official report is released. Rising readings suggest inflation pressure may be building. (Federal Reserve Bank of Cleveland)
- GDP Q4 2025 (2nd Estimate) — The government's revised estimate of how fast the economy grew in the fourth quarter of 2025, expressed as an annualized rate. This second estimate incorporates more complete data than the initial release. (Bureau of Economic Analysis)
- Atlanta Fed GDPNow Q1 — A real-time model estimate of how fast the economy is growing in the current quarter. It updates frequently as new data is released. It is not an official forecast. (Federal Reserve Bank of Atlanta)
- Personal Income — Month-over-month change in total income received by individuals, including wages, dividends, and government benefits. Rising income supports consumer spending. (Bureau of Economic Analysis)
- Personal Spending — Month-over-month change in consumer expenditures on goods and services. Consumer spending drives roughly two-thirds of U.S. economic activity. (Bureau of Economic Analysi
- Personal Saving Rate — The percentage of disposable income that households save rather than spend. A rising rate can indicate consumers are building a financial cushion or pulling back on spending. (Bureau of Economic Analysis)
On the confirmed side, February's Consumer Price Index came in at 2.4% year over year, unchanged from January and in line with expectations. That number was reassuring on the surface, but it captures prices through mid-February, before oil began its sharp move higher. The January Core PCE Price Index, the Fed's preferred inflation measure, told a less comfortable story: 3.1% year over year, up from 3.0% in December and still well above the Fed's 2% target. The Cleveland Fed's CPI Nowcast for March has already moved to 2.87%, up from 2.61%. Rising energy costs are beginning to filter into the inflation outlook even before they show up in the official data.
On the growth side, the BEA revised fourth-quarter GDP down to just 0.7% annualized, from the initial 1.4% estimate. The revision reflected weaker exports, consumer spending, government spending, and investment. The BEA has separately estimated that last fall's government shutdown subtracted about one percentage point from fourth-quarter growth, meaning the underlying economy was somewhat stronger than the headline suggests, but not strong. The Atlanta Fed's GDPNow tracker for the first quarter bounced back to 2.7% from 2.1% earlier in the week, helped by trade data, though that estimate will continue to shift as new information arrives.
The labor market was quiet this week. Initial jobless claims came in at 213,000, essentially flat. The four-week average dropped to 212,000, the lowest in several weeks, and continuing claims fell to 1.850 million. No signs of accelerating layoffs, but no signs of renewed hiring strength either. The no-hire, no-fire labor market continues. The consumer picture was more interesting: personal income rose 0.4% in January, spending held steady at 0.4%, and the personal saving rate jumped to 4.5% from 3.6% in December. Consumers earned more, spent the same, and saved the rest. Whether that reflects caution or simply timing will become clearer in the months ahead.
What the data can't answer, and what the market is actually focused on, is the trajectory of the conflict and its economic consequences. Oil prices have surged since the late-February strikes involving the U.S., Israel, and Iran, with disruptions near the Strait of Hormuz driving gasoline prices to their highest levels since 2024. How long the energy shock lasts matters more right now than any single data release. A short disruption, measured in weeks, would likely leave a manageable mark on prices and growth. A prolonged one that keeps oil elevated above $90 to $100 per barrel would change the inflation math meaningfully and put the Fed in a difficult position heading into its meeting next week.
The Federal Reserve is widely expected to hold rates steady on March 18. But the calculus is shifting. Before the war, the debate was about when the next cut might come. Now the question is whether inflation reaccelerates enough to take cuts off the table entirely, or whether slowing growth eventually forces the Fed's hand regardless. The February data suggests the economy was softening but not breaking. The open question is whether the energy shock turns a soft patch into something worse.
We're watching this closely. The data this week told us where the economy was. The weeks ahead will tell us where it's going.