

The Shiller CAPE Ratio Is Flashing Red
As of the end of October, the S&P 500 was trading at a Shiller CAPE ratio of 39.51, and has continued higher—the second-highest reading in 150 years of market history.1 Only the dot-com bubble peak exceeded this level. We're not in expensive territory. We're in bubble territory.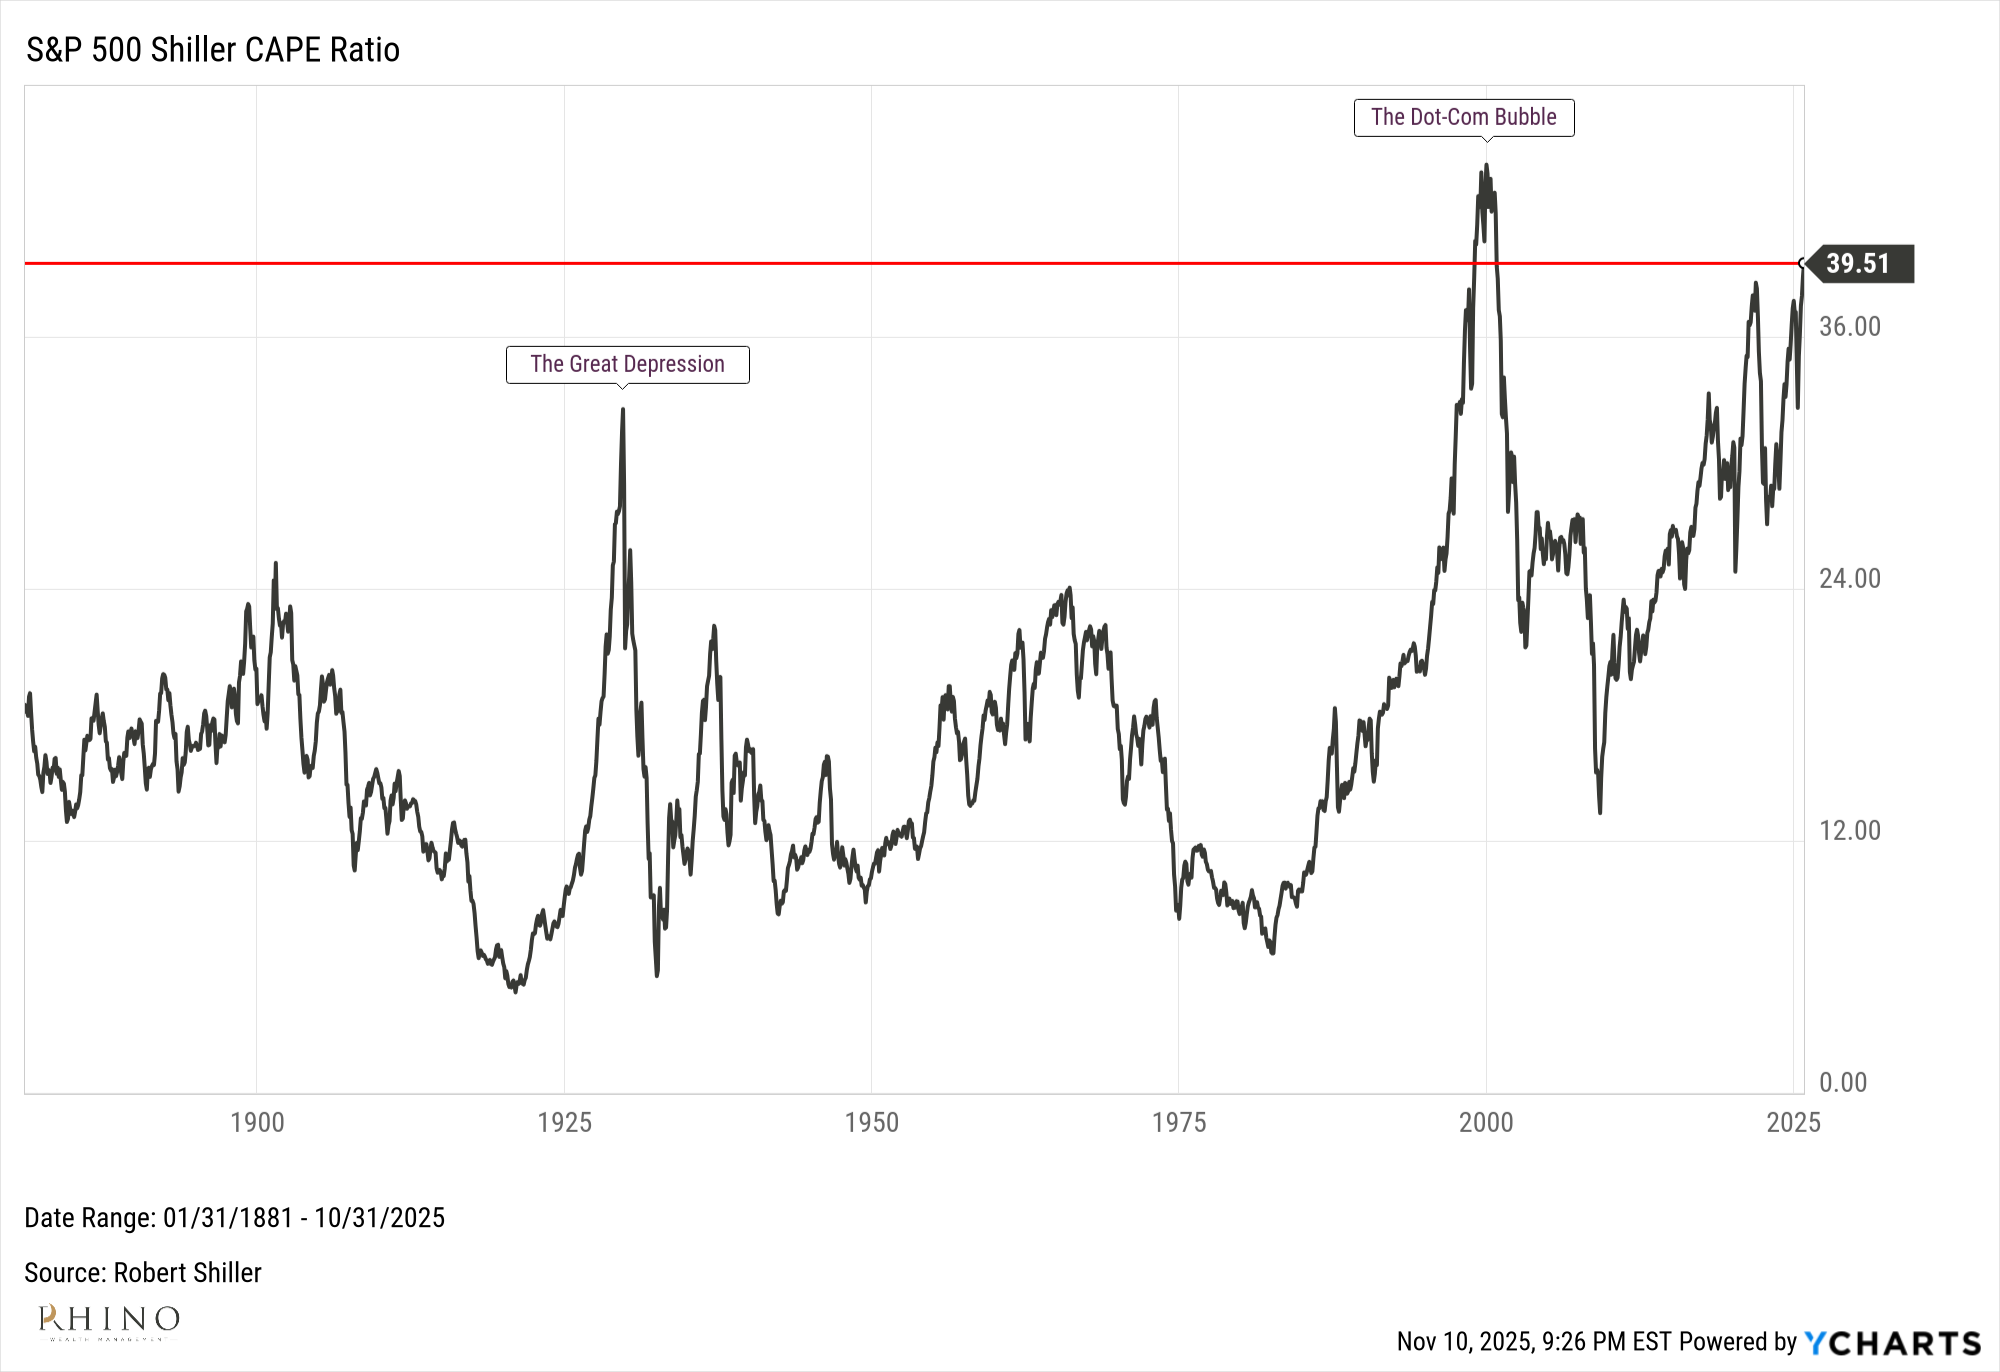
What CAPE Measures
Robert Shiller, a Yale economics professor who won the 2013 Nobel Prize in Economics, created the Cyclically Adjusted Price-Earnings ratio with John Campbell in the late 1980s.2 The formula is simple: divide current stock prices by the average of 10 years of inflation-adjusted earnings.
Why 10 years? Because corporate profits swing wildly during recessions and booms. A company might earn $100 per share one year and $20 the next during a downturn. By averaging a full decade and adjusting for inflation, CAPE filters out that noise. You see what you're really paying for long-term earning power.
Shiller compiled earnings data back to 1871, creating 150+ years of continuous market history. That matters. We can compare today's valuations against the 1929 crash, the 1970s stagflation, the dot-com bubble, and the 2008 financial crisis.3
The Historical Record
The long-term average CAPE is 17. Markets typically trade between 12 and 22.
We've breached 30 only three times:
- 1929: CAPE hit 32 before the crash that began the Great Depression
- 1999-2000: CAPE climbed to a record 44 during dot-com mania, then markets lost half their value
- 2020-present: CAPE has stayed above 30, now reaching 39.514
At 39.51, we're paying more than double the historical average. We're just 4.5 points below the all-time record set in December 1999—right before the worst 10-year returns in modern history.
What History Shows
Shiller's research demonstrates that CAPE has historically been associated with forward 10-year returns. When investors bought at CAPE levels above 35, the subsequent decade typically delivered low or negative real returns. When they bought at CAPE 12-15, returns averaged in the double digits.5
After the 1999 peak at CAPE 44, the S&P 500 lost value over the following decade after inflation. The 2000s became the "lost decade" for stocks. After the 2009 bottom at CAPE 13, markets tripled.6
We're now 90% of the way back to the valuation extreme that preceded those poor returns.
Why Bulls May Be Wrong
Market optimists say higher profit margins or technology justify these valuations. They said the exact same thing in 1999. The internet changed everything. Old metrics didn't apply. Traditional rules were broken.
Then earnings dropped, valuations collapsed, and CAPE's relationship to returns held.
CAPE already includes a full decade of today's higher margins in its calculation. You're paying 39.51 times those improved 10-year average earnings. The margin expansion bulls cite as justification is already reflected in the ratio.
The Math You Face
At CAPE 39.51, you're looking at one of three scenarios:
- Earnings grow faster than historical averages for years
- Valuations climb above the dot-com peak to set a new all-time record
- Returns may remain subdued for an extended period
Scenario one requires sustained above-average profit growth. Scenario two means believing stocks are heading to valuations never seen in 150 years. Scenario three aligns with the historical pattern.
When CAPE has reached levels near 40, subsequent 10-year real returns have historically averaged in the low single digits.7
The Bottom Line
Valuation metrics including CAPE are monitored by institutional investors and policymakers for financial stability assessment.8 Shiller maintains updated monthly data through Yale's economics department, making every calculation transparent and verifiable.9
In 150 years of data, we've seen valuations this extreme twice: before the 1929 crash and during the dot-com bubble. In both cases, the following decade delivered poor returns.
CAPE doesn't predict timing. Markets can remain expensive for extended periods. But at 39.51, current valuations sit at historically extreme levels. Understanding this context matters for setting appropriate return expectations.
Disclosure
This material is provided by Todd Van Der Meid, MBA, CFP®, through Rhino Wealth Management, Inc., a Registered Investment Adviser, solely for informational purposes. It is not intended as investment, tax, legal, or accounting advice. Investors should consult qualified professionals before making financial decisions.
Opinions expressed herein are general in nature and not tailored to individual circumstances. Investment strategies discussed may not be suitable for every investor. All investments carry risk, including possible loss of principal, and past performance does not guarantee future results. No investment strategy or risk management technique ensures profit or eliminates risk in all market conditions.
Investments in foreign or emerging markets involve additional risks, such as currency fluctuations, geopolitical instability, and varying accounting standards. Sector-specific investments can be more volatile due to their concentrated nature. References to indexes are for illustrative purposes; indexes are unmanaged, cannot be invested into directly, and their performance does not reflect fees, expenses, or sales charges. Index performance is not indicative of specific investment performance.
Economic forecasts and forward-looking statements reflect current views and assumptions and are subject to change. Actual results may vary materially due to market or other conditions. There is no obligation to update forward-looking information.
Information presented herein comes from reliable third-party sources but is not guaranteed for accuracy or completeness. Rhino Wealth Management, Inc. disclaims liability for errors or omissions. Portions of this content may be generated using advanced analytical tools, including artificial intelligence, and all such content has been reviewed and validated by Todd Van Der Meid, MBA, CFP®, using proprietary quality-control measures. Rhino Wealth Management, Inc. does not directly hold securities; however, securities mentioned may be included within recommended portfolio models or held by clients. Please refer to our Form ADV for additional details regarding potential conflicts of interest.