


Zero to 78
The S&P 500 closed the week at 7,408, up 0.13%, after crossing 7,500 for the first time in history on Thursday.
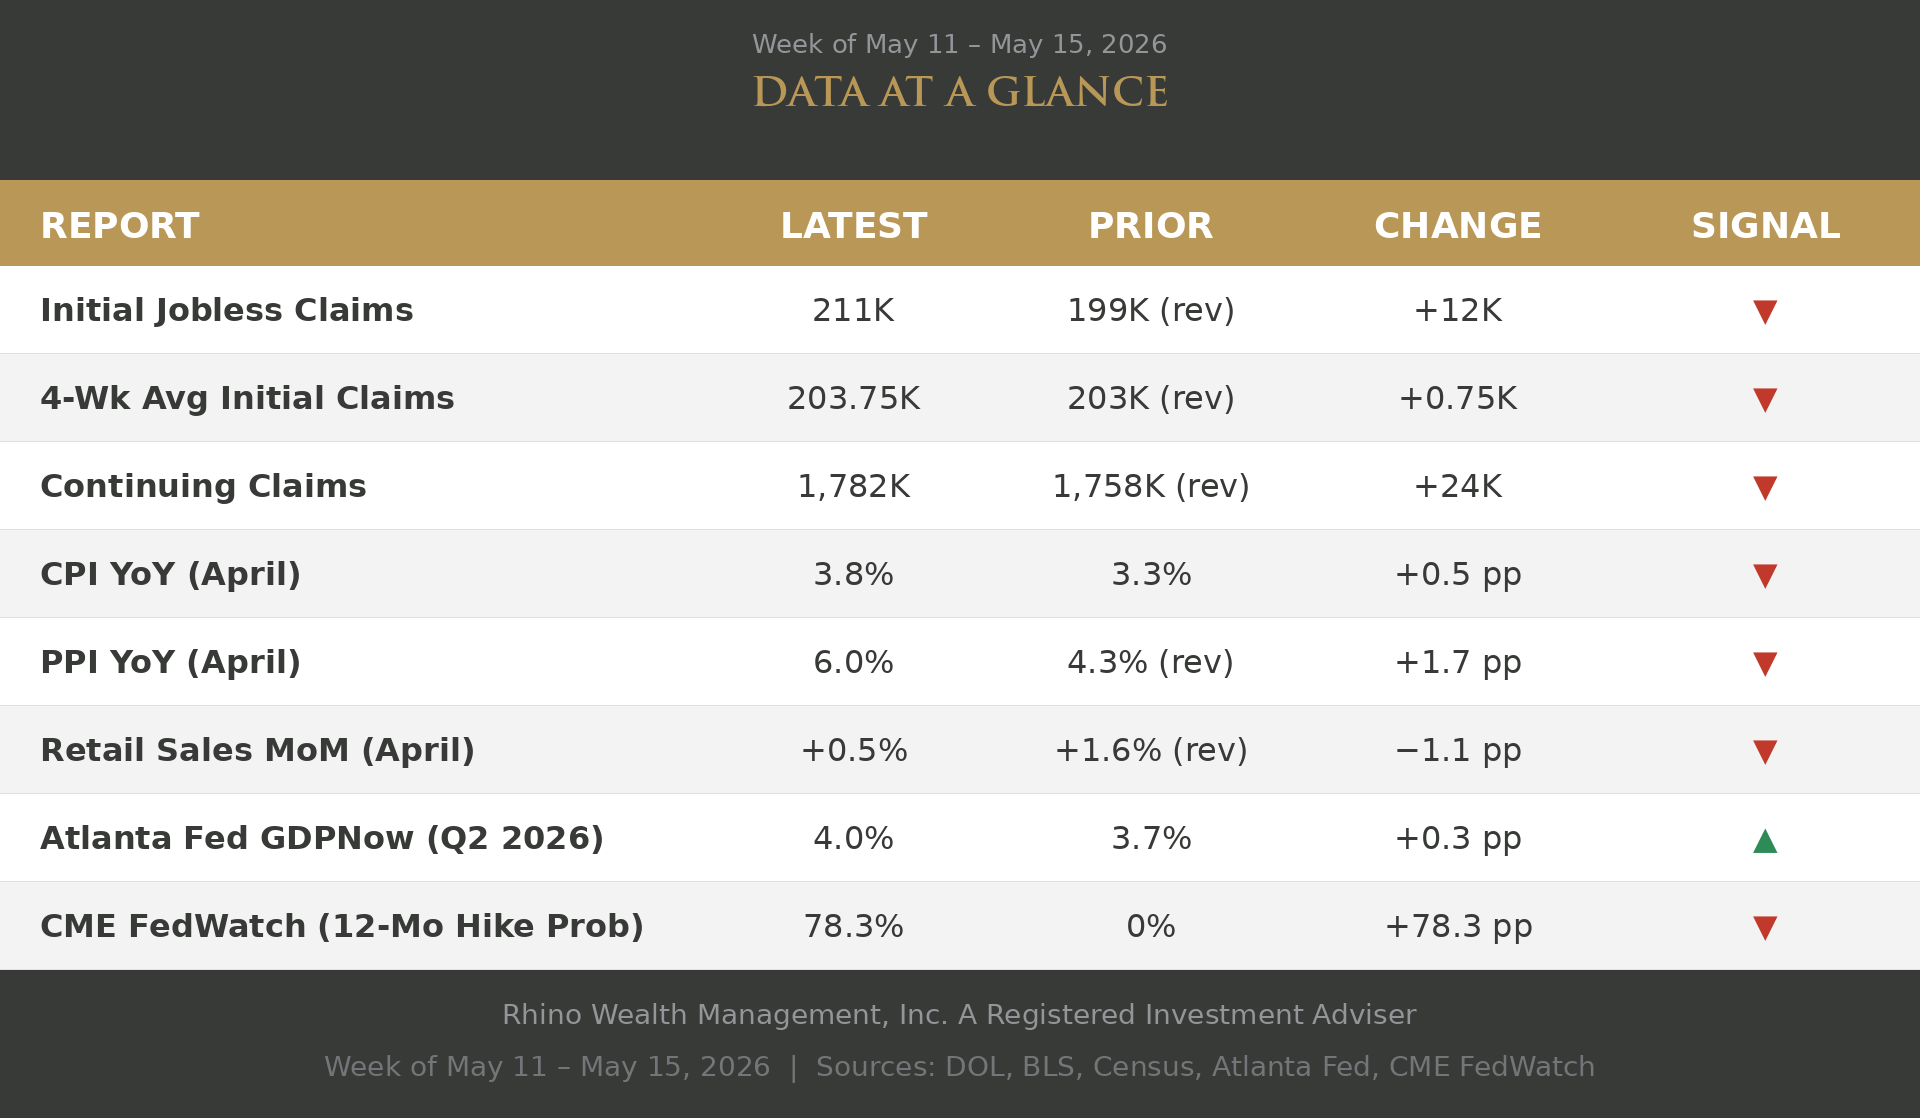
One number frames this entire week. Last Friday, CME FedWatch showed a zero percent probability that the Fed would raise or cut rates within the next 12 months. By the time this week closed, that number had changed to a 78% probability of a rate hike.
Why would the Fed raise interest rates? The Consumer Price Index (CPI) on Tuesday and the Producer Price Index (PPI) on Wednesday showed what Americans already know: inflation is accelerating. Then Friday's industrial production and manufacturing data pushed those odds further. Strength in the manufacturing sector suggests an economy heating up. Four days, a handful of data releases, and the market's entire outlook on Federal Reserve policy reversed.
Inflation's One-Two Punch
Headline CPI came in at 3.8% year-over-year for April, up from 3.3% in March and above the 3.7% most economists expected. Core CPI, which strips out food and energy, rose to 2.8%, also ahead of expectations. That's two consecutive months of accelerating inflation, and April was the hottest reading in over a year.
But CPI wasn't the real shock. PPI was.
The Producer Price Index measures what businesses pay for inputs before those costs reach consumers. April's reading came in at 6.0% year-over-year, sharply higher than March and well above what most economists expected. Import prices alone rose nearly 2% in a single month. These aren't rounding errors. They're what happens when global trade gets disrupted and the bills start coming due.
The Strait of Hormuz has been largely closed since U.S. and Israeli strikes on Iran in late February, and the situation remains fluid. The strait carries roughly 20% of the world's seaborne oil trade. When it's disrupted, the cost doesn't stay out of the data for long. It showed up in March's import prices and again in April's.
The gap between the two numbers matters. When producer prices run more than two percentage points hotter than consumer prices, it signals that businesses are absorbing costs that haven't reached your grocery bill yet. CPI tells you where inflation has been. PPI tells you where it's going.
Either companies pass those higher costs on to consumers through higher prices, or they absorb them. If they absorb them, earnings fall. When earnings fall, markets tend to follow.
An Economy That Won't Slow Down
Here's where the story gets complicated. If inflation were rising because the economy was overheating, the Fed's path would be straightforward: tighten until demand cools. But the growth data this week didn't describe an economy that needs cooling. It described one running at full speed.
The Atlanta Fed's GDPNow model, which tracks GDP growth in real time, moved to 4.0% for the second quarter, up from 3.7% last week, driven by the retail and trade data. Retail sales rose 0.5% in April, in line with expectations. Industrial production beat handily, rising 0.7% against a 0.3% forecast. Whatever demand slowdown the market was pricing in hasn't shown up in the hard data yet.
Labor held, too. Initial jobless claims rose 12,000 to 211,000 for the week ending May 9, and continuing claims edged up to 1.782 million. Both are still low by historical standards, though the trend is no longer declining.
The Week's Other Story
President Trump wrapped a two-day summit with President Xi Jinping in Beijing on Friday, the first presidential visit to China in nine years. Both sides were warm. Trump called the results "fantastic trade deals." The actual commitments were more measured: China agreed in principle to buy U.S. crude oil and 200 Boeing jets, roughly half the 500 the market had expected. No comprehensive trade agreement was reached. Iran and Taiwan were both on the agenda. Trump said the two leaders discussed ending the war. No breakthrough on either.
The supply-side cost pressures running through the PPI don't have a resolution coming out of Beijing this week.
The Fed's Problem
Supply-side inflation is a specific kind of problem because the usual remedy doesn't fix it. Raising interest rates slows demand. It doesn't reopen a closed trade route or reverse a tariff. The inflation running through the PPI right now is largely a function of trade costs. Import prices are up 4.2% year-over-year. It's not consumer demand running ahead of supply.
The Fed holds rates steady at 3.50-3.75%, unchanged since last fall. With the economy growing near 4%, there's no case for cuts. With inflation at 3.8% and rising, there's growing market pressure to hike. That's precisely why the market moved from pricing in no action at all to a 78% chance of a hike over the course of the week. But hiking into supply-side inflation risks punishing growth without fixing prices. The Fed can't make shipping lanes cheaper or tariffs lower with a rate decision.
That's the bind. Not stagflation yet. The economy is far too strong for that word. But it's a version of the same underlying problem: inflation that rate hikes can't easily cure, in an economy that doesn't need rate cuts.
The Takeaway
The story this week isn't just that inflation surprised. It's that the surprise was large enough, and the growth data strong enough, to reprice the entire Fed outlook from doing nothing to a 78% chance of a rate hike in a single week.
The PPI pipeline says the pressure isn't done. If trade costs keep feeding through to consumer prices, May CPI could arrive at 4% or above. An economy growing near 4% while inflation reaccelerates toward 4% is territory the Fed has almost no precedent for.
That's worth watching. Not with alarm. The underlying data is strong, not broken. But with clear eyes about what the next few months of inflation prints are likely to show.
See glossary below for definitions of each metric.
Glossary
- Initial Jobless Claims — The number of people filing for unemployment benefits for the first time in a given week. One of the most timely reads on layoffs and labor-market stress. Source: Department of Labor (DOL).
- 4-Wk Avg Initial Claims — A four-week rolling average of initial claims. Smooths week-to-week volatility to reveal the underlying trend. Source: DOL.
- Continuing Claims — The number of people still receiving unemployment benefits after their initial filing. Signals how easily displaced workers are finding new jobs. Source: DOL.
- CPI YoY — Consumer Price Index, year-over-year change. Measures how much prices for everyday goods and services have risen compared to a year ago. The primary official gauge of consumer inflation. Source: Bureau of Labor Statistics (BLS).
- PPI YoY — Producer Price Index, year-over-year change. Measures price changes at the wholesale level, what businesses pay for inputs before those costs reach consumers. Often leads CPI by a few months. Source: BLS.
- Retail Sales MoM — Month-over-month change in consumer spending at retail stores and restaurants. One of the most direct reads on consumer demand. Source: Census Bureau.
- Atlanta Fed GDPNow — A real-time estimate of current-quarter GDP growth built from incoming economic data as it's released. It's a nowcast, not an official Bureau of Economic Analysis (BEA) release, and it updates throughout the quarter. Source: Atlanta Fed.
- CME FedWatch (12-Mo Hike Prob) — The market-implied probability that the Fed raises interest rates at least once within the next 12 months, derived from Fed Funds futures pricing. Source: CME FedWatch.
Disclosure
This material is provided by Todd Van Der Meid, MBA, CFP®, through Rhino Wealth Management, Inc., a Registered Investment Adviser, solely for informational purposes. It is not intended as investment, tax, legal, or accounting advice. Investors should consult qualified professionals before making financial decisions.
Opinions expressed herein are general in nature and not tailored to individual circumstances. Investment strategies discussed may not be suitable for every investor. All investments carry risk, including possible loss of principal, and past performance does not guarantee future results. No investment strategy or risk management technique ensures profit or eliminates risk in all market conditions.
Investments in foreign or emerging markets involve additional risks, such as currency fluctuations, geopolitical instability, and varying accounting standards. Sector-specific investments can be more volatile due to their concentrated nature. References to indexes are for illustrative purposes; indexes are unmanaged, cannot be invested into directly, and their performance does not reflect fees, expenses, or sales charges. Index performance is not indicative of specific investment performance.
Economic forecasts and forward-looking statements reflect current views and assumptions and are subject to change. Actual results may vary materially due to market or other conditions. There is no obligation to update forward-looking information.
Information presented herein comes from reliable third-party sources but is not guaranteed for accuracy or completeness. Rhino Wealth Management, Inc. disclaims liability for errors or omissions. Portions of this content may be generated using advanced analytical tools, including artificial intelligence, and all such content has been reviewed and validated by Todd Van Der Meid, MBA, CFP®, using proprietary quality-control measures. Rhino Wealth Management, Inc. does not directly hold securities; however, securities mentioned may be included within recommended portfolio models or held by clients. Please refer to our Form ADV for additional details regarding potential conflicts of interest.